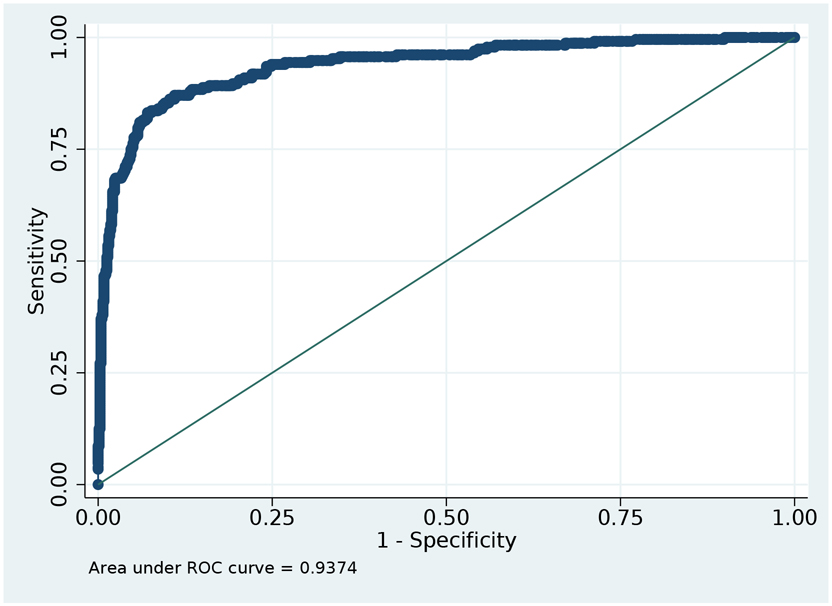
FIGURE 3: Area under ROC curve: tradeoff between sensitivity and specificity.
Figure is based on the analytic sample. Area Under the ROC curve = 0.94. Figure 3 provides the AUROC as it relates to varying sensitivity and 1-specificity and illustrates the point that AUROC is maximized. We display in Figure 3 the performance reference to Model 7 which used a Refined Claims-Based Definition and Diagnostic Claim Count.

