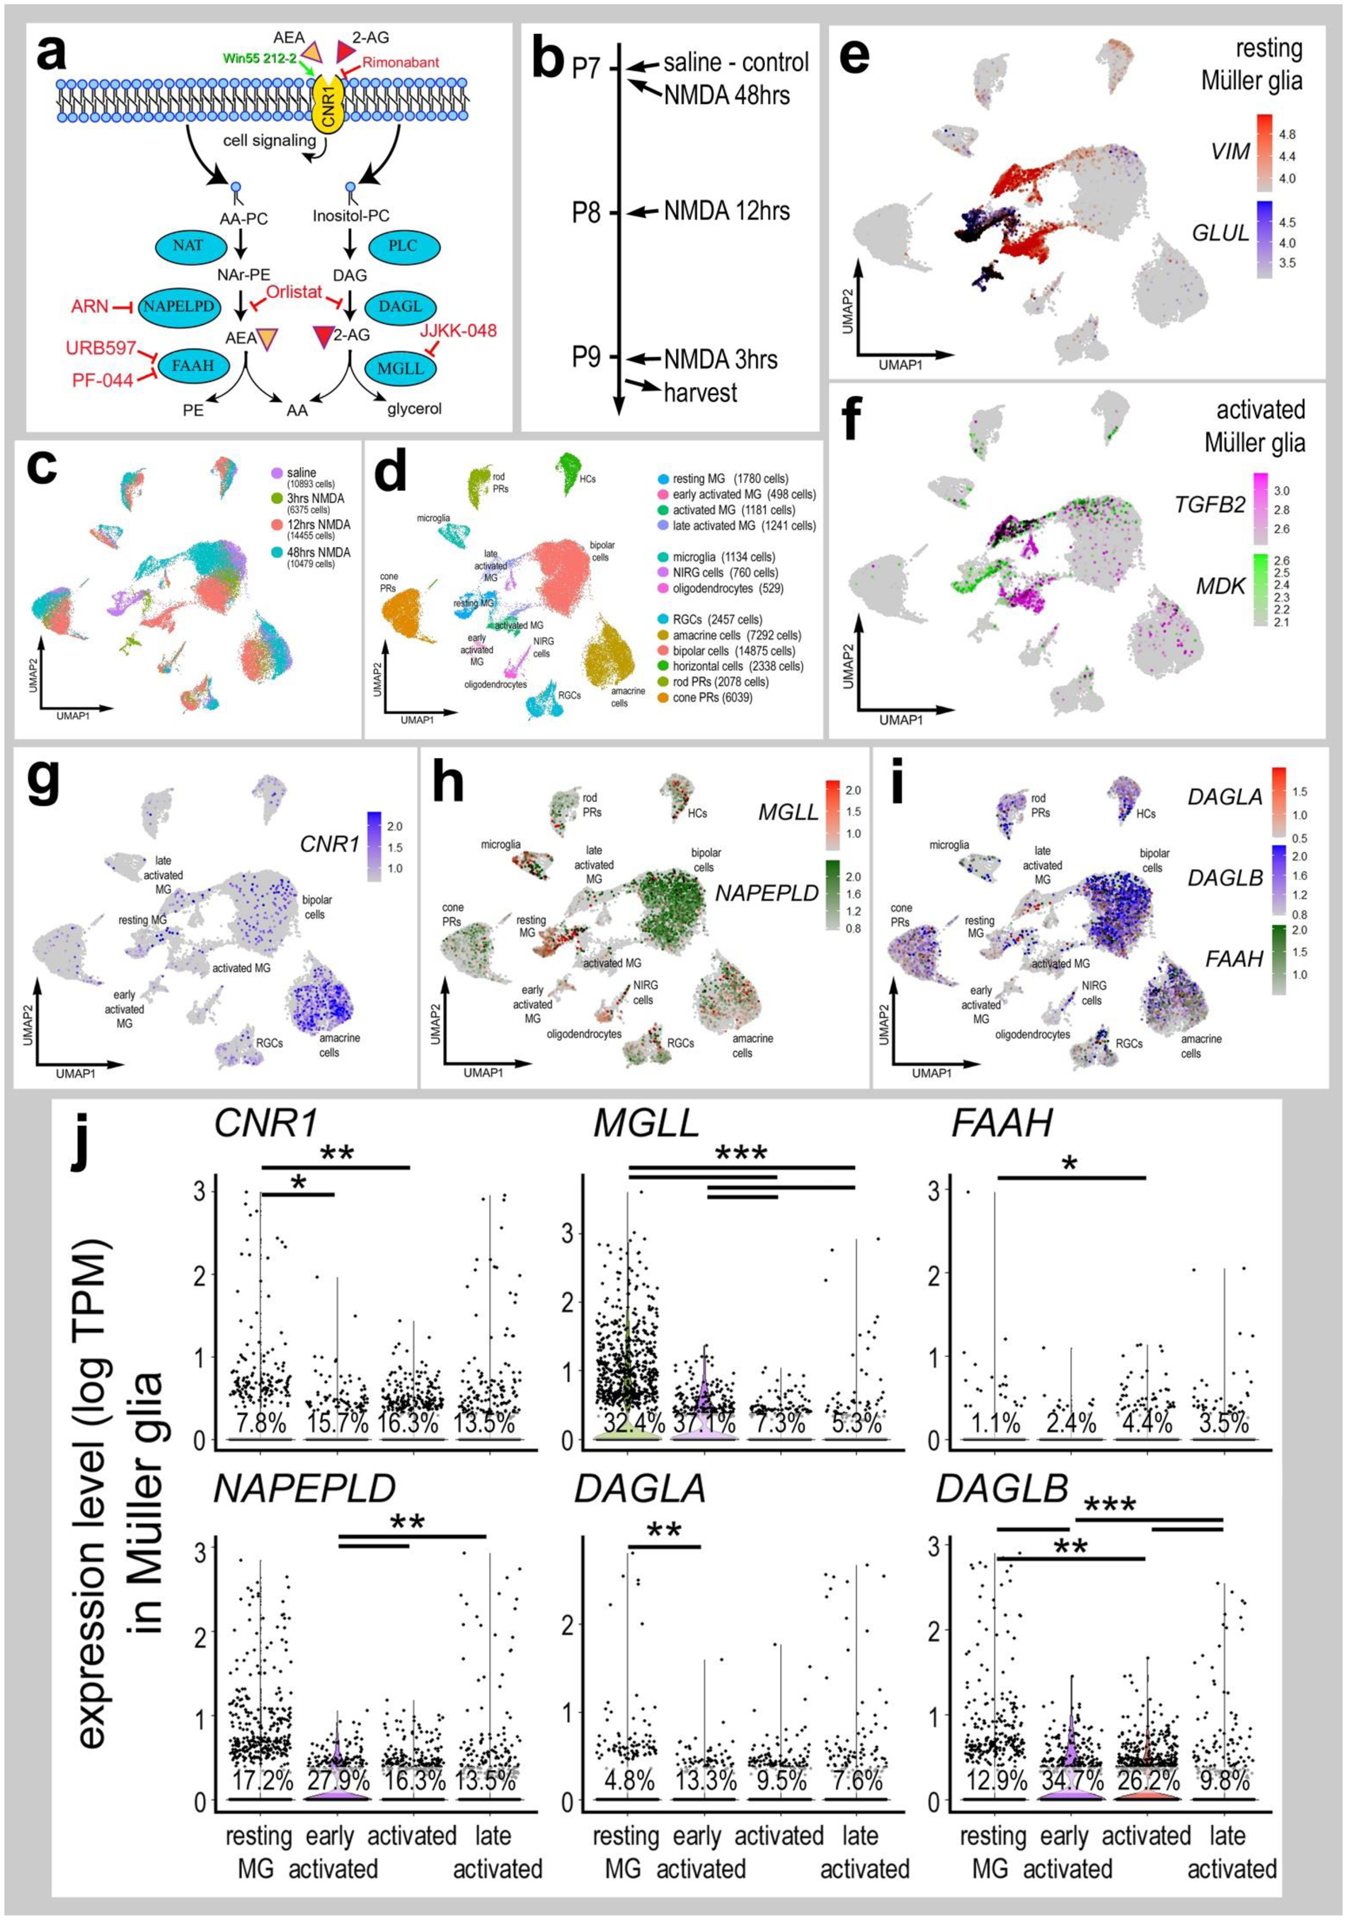
Figure 1. eCB-related genes are widely expressed in different types of retinal cells.

Panel a illustrates a schematic diagram of the enzymes and receptors involved in eCB synthesis, degradation and signaling. Panel b illustrates the treatment paradigm and times (3, 12 and 48 hours) for harvesting retinas after NMDA-treatment. scRNA-seq was used to identify patterns of expression of eCB-related genes among retinal cells. Patterns and levels of expression are presented in UMAP plots (c–i) and violin plots (j. UMAP-ordered cells formed distinct clusters of neuronal cells, resting MG, early activated MG, activated MG and late activated MG (c–f). UMAP heatmaps of CNR1, MGLL, NAPEPLD, DAGLA, DAGLB and FAAH demonstrate patterns and levels of expression across different retinal cells, with black dots representing cells with expression of 2 or more genes (g–i). Violin plots illustrate relative levels and percent of expression in resting and activated MG (j). Violin plots illustrate levels of gene expression and significant changes (*p<0.01, **p<10exp-10, ***p<10exp-20) in levels that were determined by using a Wilcox rank sum with Bonferroni correction.
