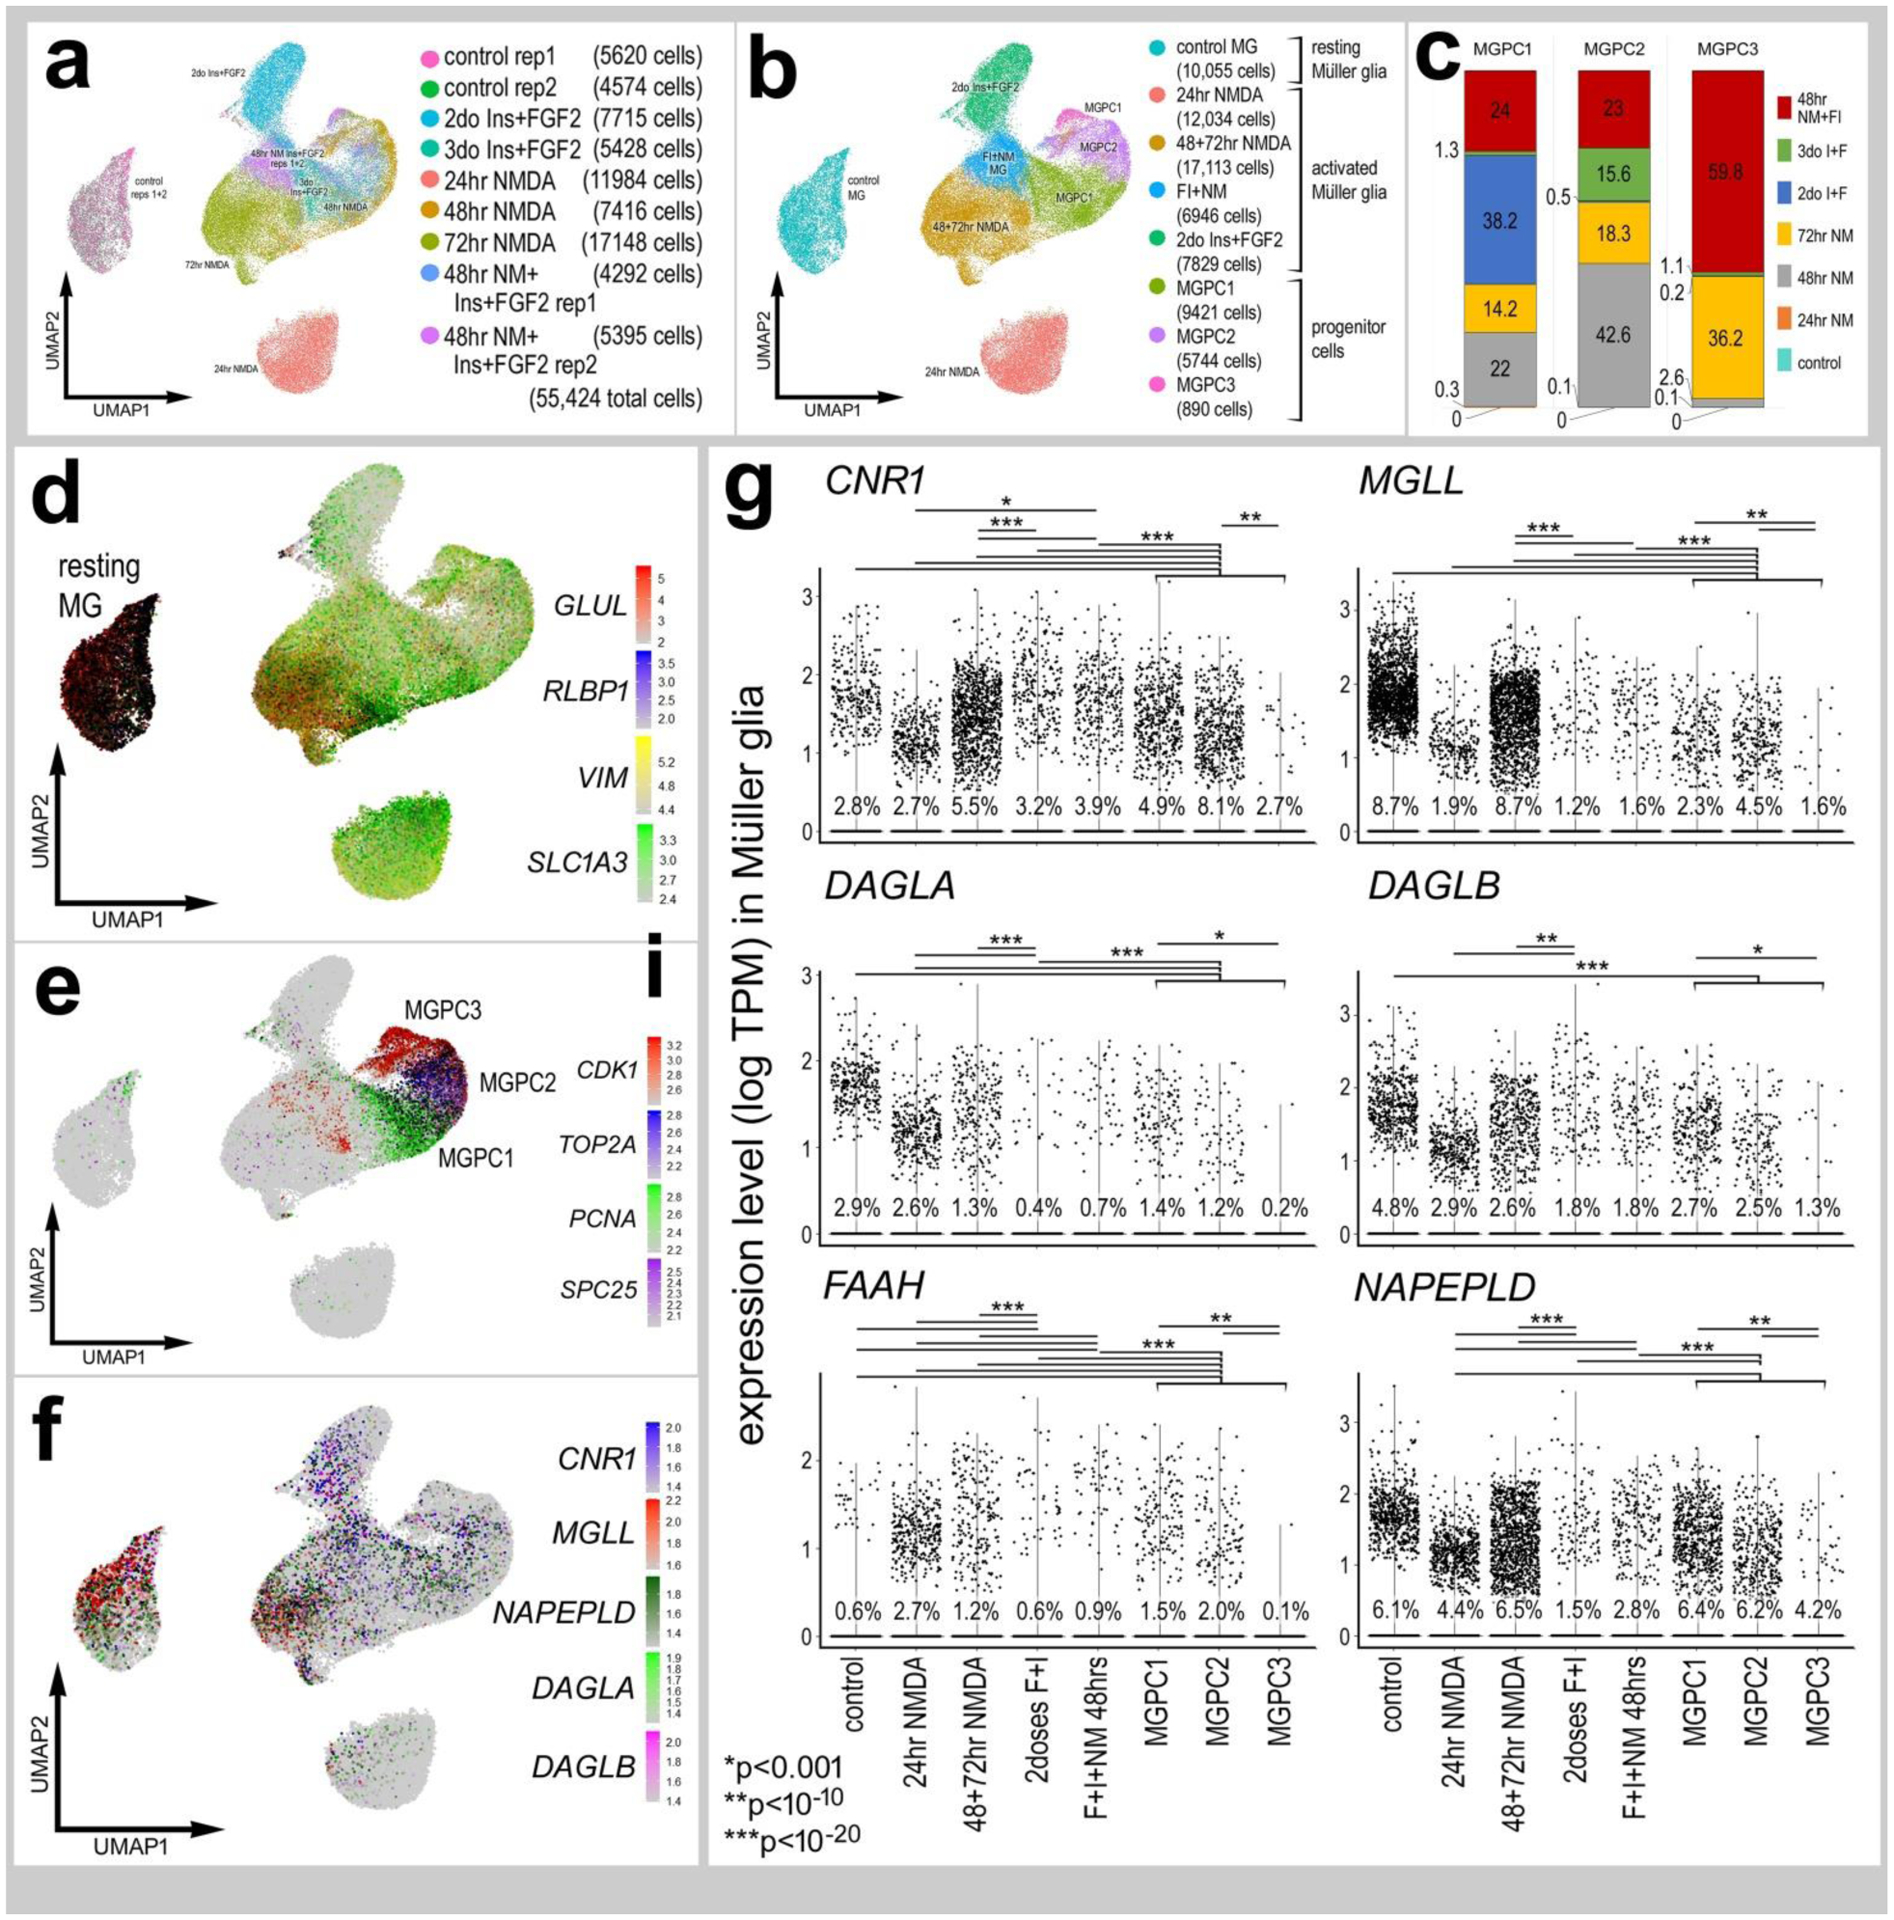
Figure 2. eCB-related genes are dynamically expressed by MG in response to damage or growth-factor treatment.

scRNA-seq was used to identify patterns of expression of eCB genes in MG and MGPCs at different time points after NMDA damage and/or FGF + insulin growth factor treatment (a). UMAP clusters of MG were identified by expression of cell-distinguishing genes resting MG (b,d), activated MG, and MGPCs (b,c,e). MGPCs were comprised of cells from different treatment group; predominantly cells from retinas at 72 hrs after NMDA-treatment and 48 hrs after NMDA+insulin+FGF2 (c, e). Each dot represents one cell and black dots indicate cells that express 2 or more genes. The expression of eCB related genes (CNR1, MGLL, DAGLA, DAGLB, FAAH and NAPEPLD) is illustrated in UMAP with overlays of expression heatmaps and violin plots with percentage expression and statistical comparisons. (f,g). Significant difference (*p<0.01, **p<0.0001, ***p<<0.0001) was determined by using a Wilcox rank sum with Bonferroni correction. MG – Müller glia, MGPC – Müller glia-derived progenitor cell.
