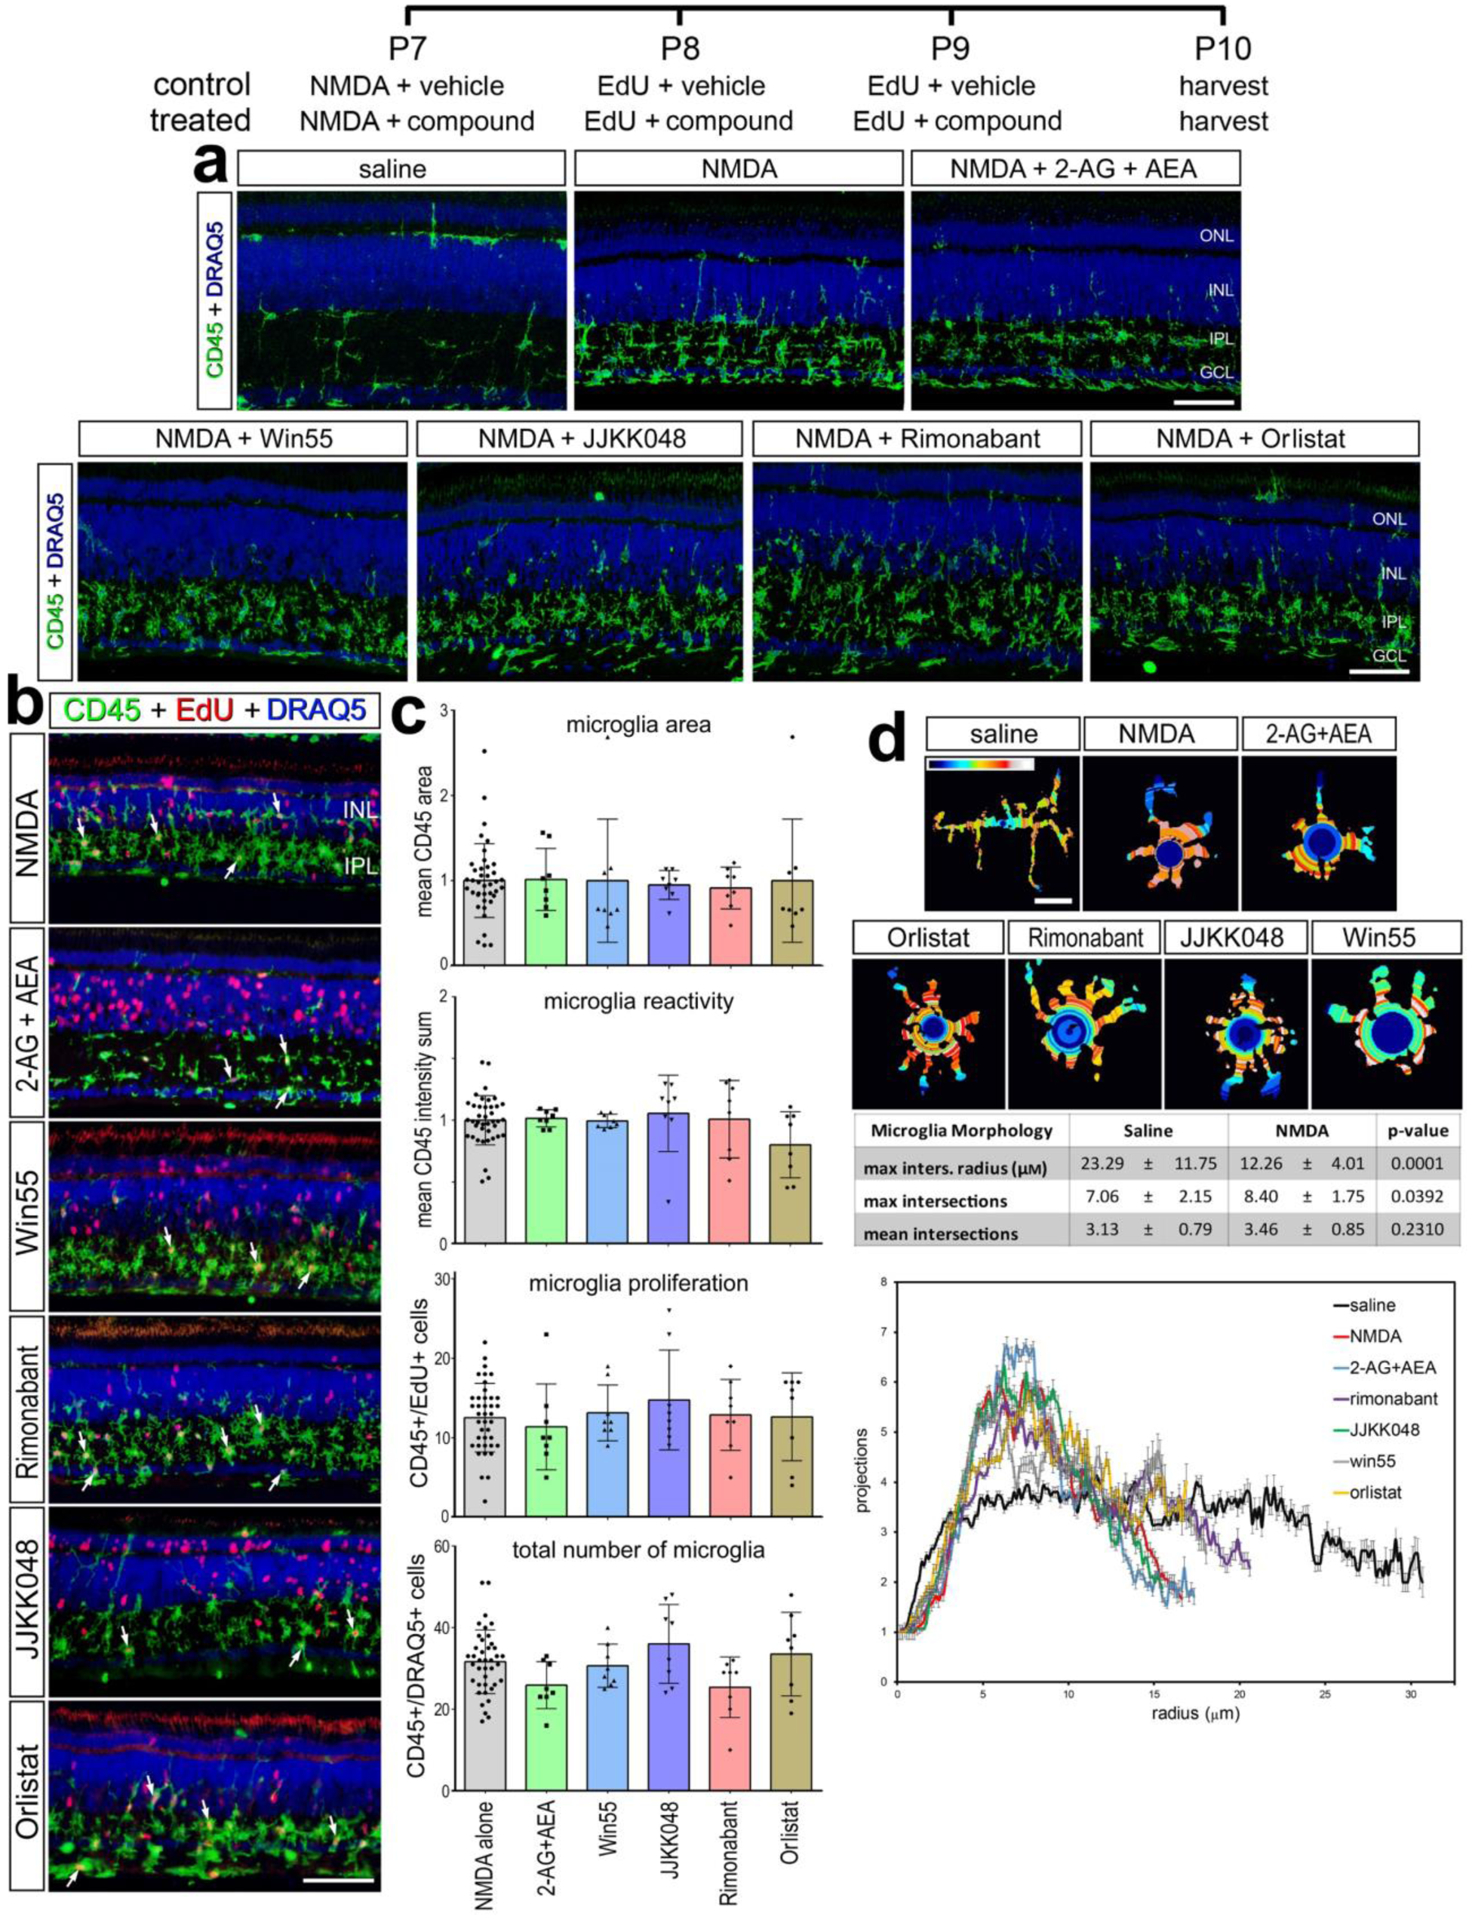
Figure 6. Microglia reactivity in damaged retina treated with eCBs.

The treatment paradigm is illustrated at the top of the figure. Compounds included 2-AG+AEA (CNR1 agonists), Orilstat (DAGL inhibitor), JJKK048 (MGLL inhibitor), Win55 (CNR1 agonist), and Rimonabant (CNR1 antagonist). Eyes were harvested 24hrs after the last injection and retinas were processed for immunofluorescence. Retinal sections were labeled for CD45 (green) and DAPI (blue; a), or CD45 (green), EdU (red) and DAPI (blue; b). Microglial reactivity was assessed by measuring CD45 area and intensity, proliferation (EdU+), and total number of microglia (CD45+/DRAQ5+) (b). Arrows indicate the nuclei of microglia. Histograms in c illustrate the mean (±SD, control n = 40, treatment n = 8) and each symbol represents one biological replicate. The shape of the microglia was assessed using a Sholl analysis. Representative microglia from each condition is shown, with a heat map of radial intersections (blue = low, red/white = high) (c). The graph in d illustrates of the number of processes radially (μm±SE) from microglial nuclei from control (n=15) and NMDA damaged (n = 25) retinas. (d) Significance of difference was determined by using a one way ANOVA with corresponding Tukey’s test. The calibration bars panels a, b represent 50 μm, and the bar in d represents 5 μM. Abbreviations: ONL – outer nuclear layer, INL – inner nuclear layer, IPL – inner plexiform layer, GCL – ganglion cell layer.
