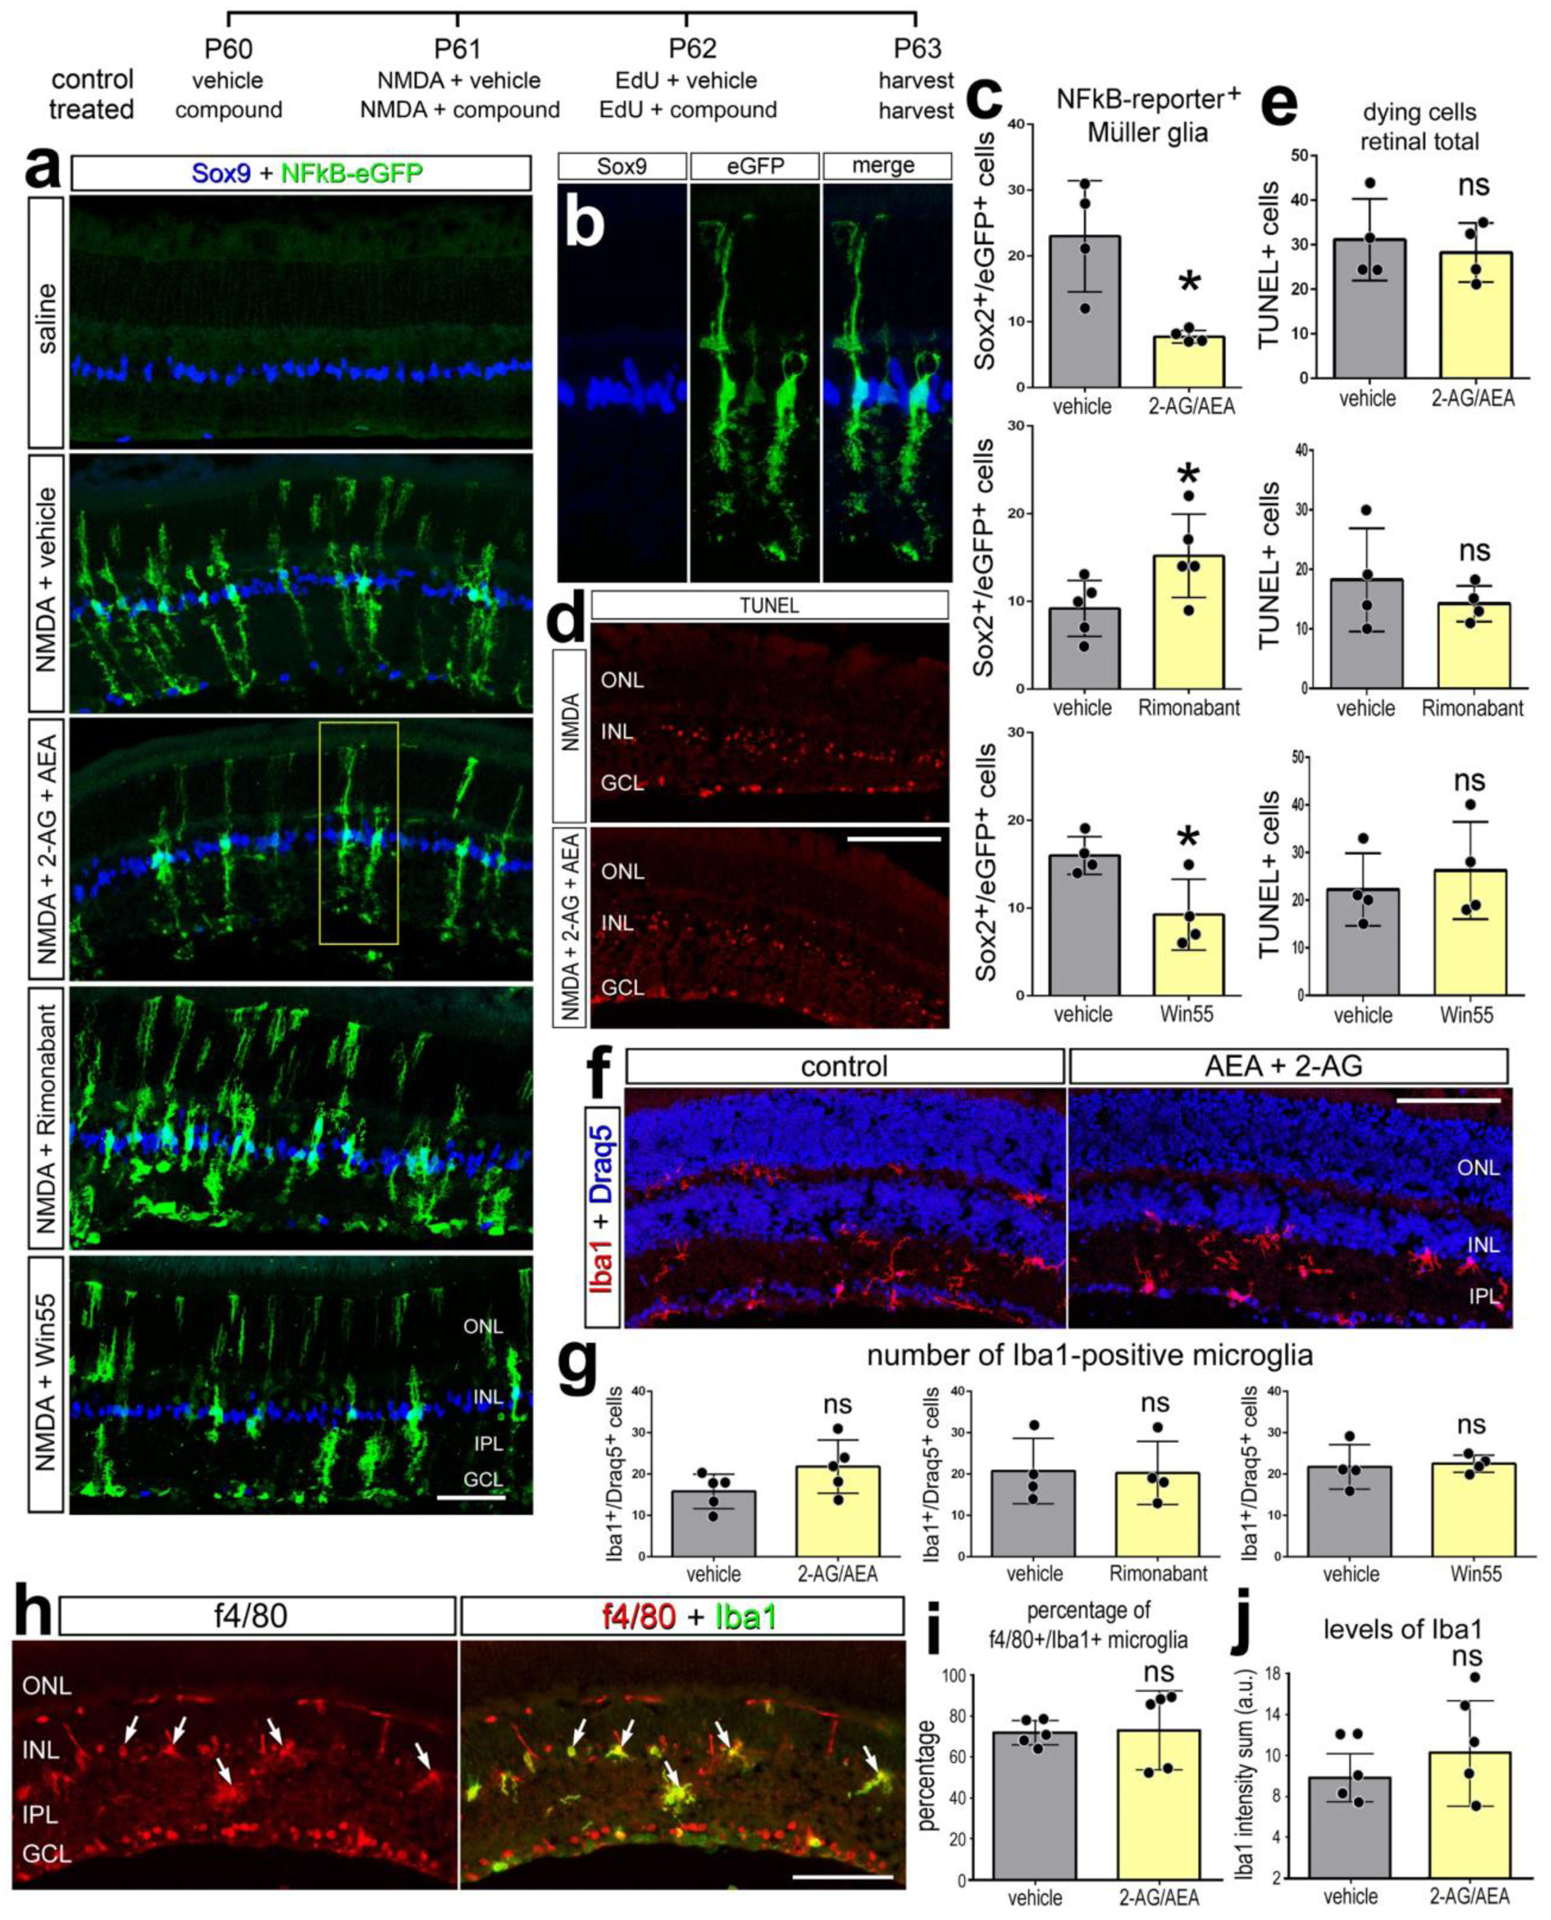
Figure 8. eCBs and NFkB-signaling in MG of damaged mouse retinas.

The treatment paradigm is illustrated at the top of the figure. Eyes of mice (cisNFkBeGFP) were pretreated with compounds or vehicle prior to NMDA + vehicle/compound, and retinas harvested 24 hrs after the last injection. Compounds included 2-AG+AEA (CNR1 agonists), Win55 (CNR1 agonist), and Rimonabant (CNR1 antagonist). Retinal sections were labeled for Sox9 (blue) and eGFP (green) (b), fragmented DNA using the TUNEL method (d), and Iba1 (red, f; green, h), Draq5 (blue; f), and f4/80 (red; h). The histogram/scatter-plots illustrate the mean (±SD) number of eGFP+ MG (c), dying cells (e) Iba1+/Draq5+ cells (g), percentage of Iba1+ microglia that are co-labeled for f4/80 (i), or the fluorescence intensity sum for Iba1 (j). Arrows indicate microglia double-labeled for f4/80 and Iba1. Each dot represents one biological replicate. Significance of difference (*p<0.05) was determined by using a paired t-test. The calibration bars panels a, d, f, and h represent 50 μm. Abbreviations: ONL – outer nuclear layer, INL – inner nuclear layer, IPL – inner plexiform layer, GCL – ganglion cell layer.
