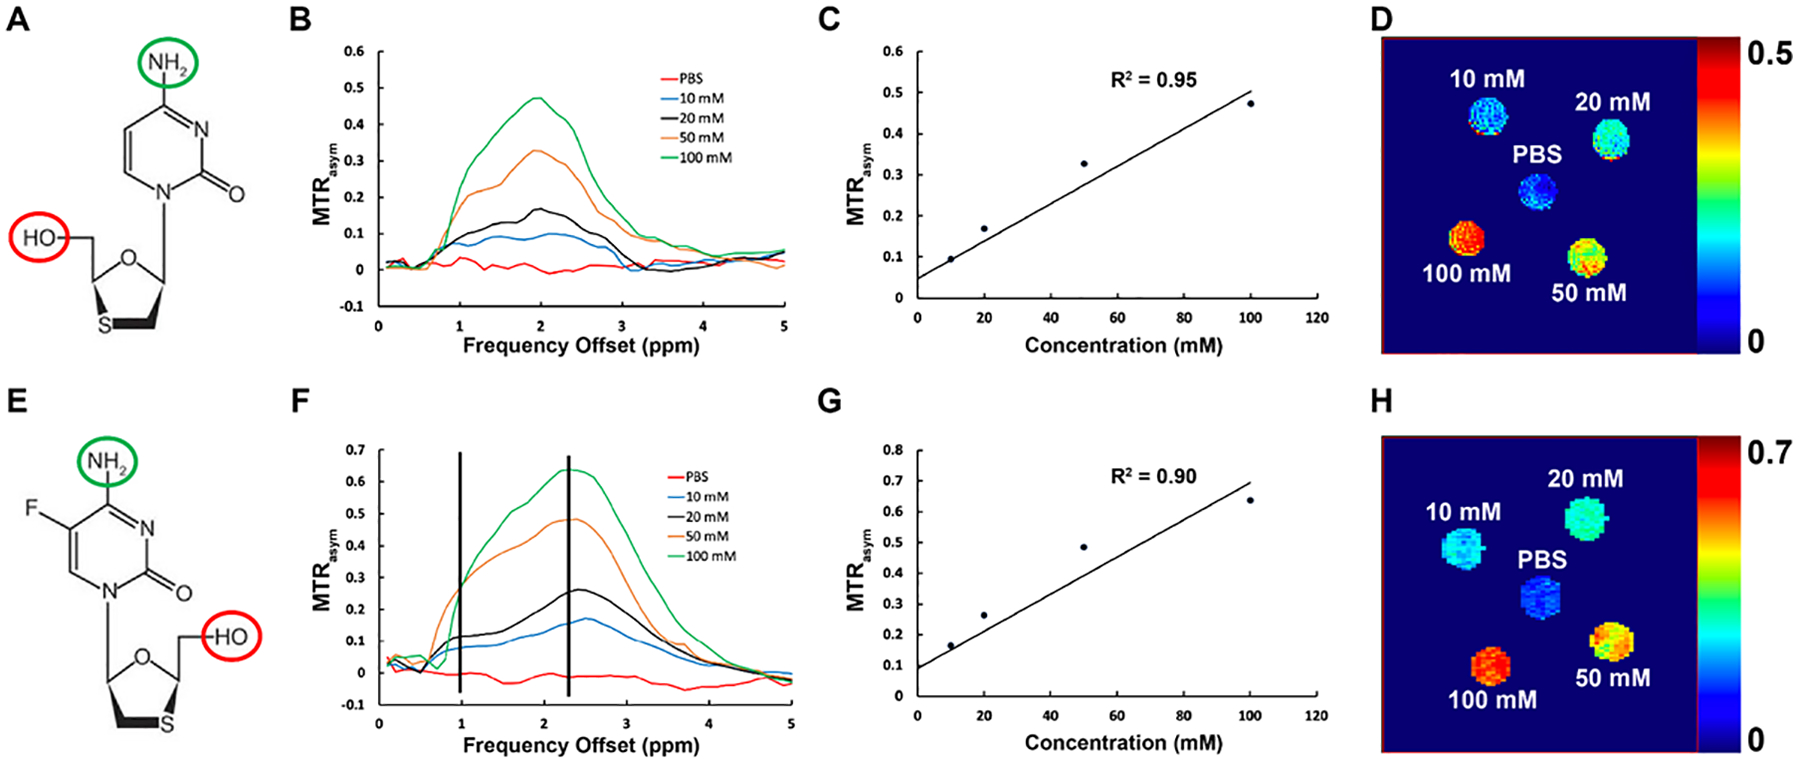
Figure 1.

Chemical exchange saturation transfer (CEST) effects of 3TC and FTC. (A) Chemical structure of 3TC. The hydroxyl group is enclosed in red circle, and the amino group is enclosed in blue circle. (B) MTR plots of 3TC and PBS (control) at 37°C. MTR increases at 1 ppm and 2 ppm with the 3TC concentration. PBS did not show CEST effect. (C) 3TC amino proton CEST effect (MTR@2ppm) increases linearly with 3TC concentration (R2 = 0.95). (D) Pixel-by-pixel heatmaps of 3TC samples. Color intensity increases with 3TC concentration. The color bar for the heatmaps is at the side of the figure represents MTR values. (E) Chemical structure of FTC. The hydroxyl group is enclosed in red circle, and the amino group is enclosed in blue circle. (F) MTR plots of FTC and PBS (control) at 37°C. MTR increases at 1 ppm and 2 ppm with the FTC concentration. PBS did not show CEST effect. (G) FTC amino proton CEST effect (MTR@2ppm) increases linearly with FTC concentration (R2 = 0.90). (H) Pixel-by-pixel heatmaps of FTC samples. Color intensity increases with FTC concentration. The color bar for the heatmaps is at the side of the figure represents MTR values.
