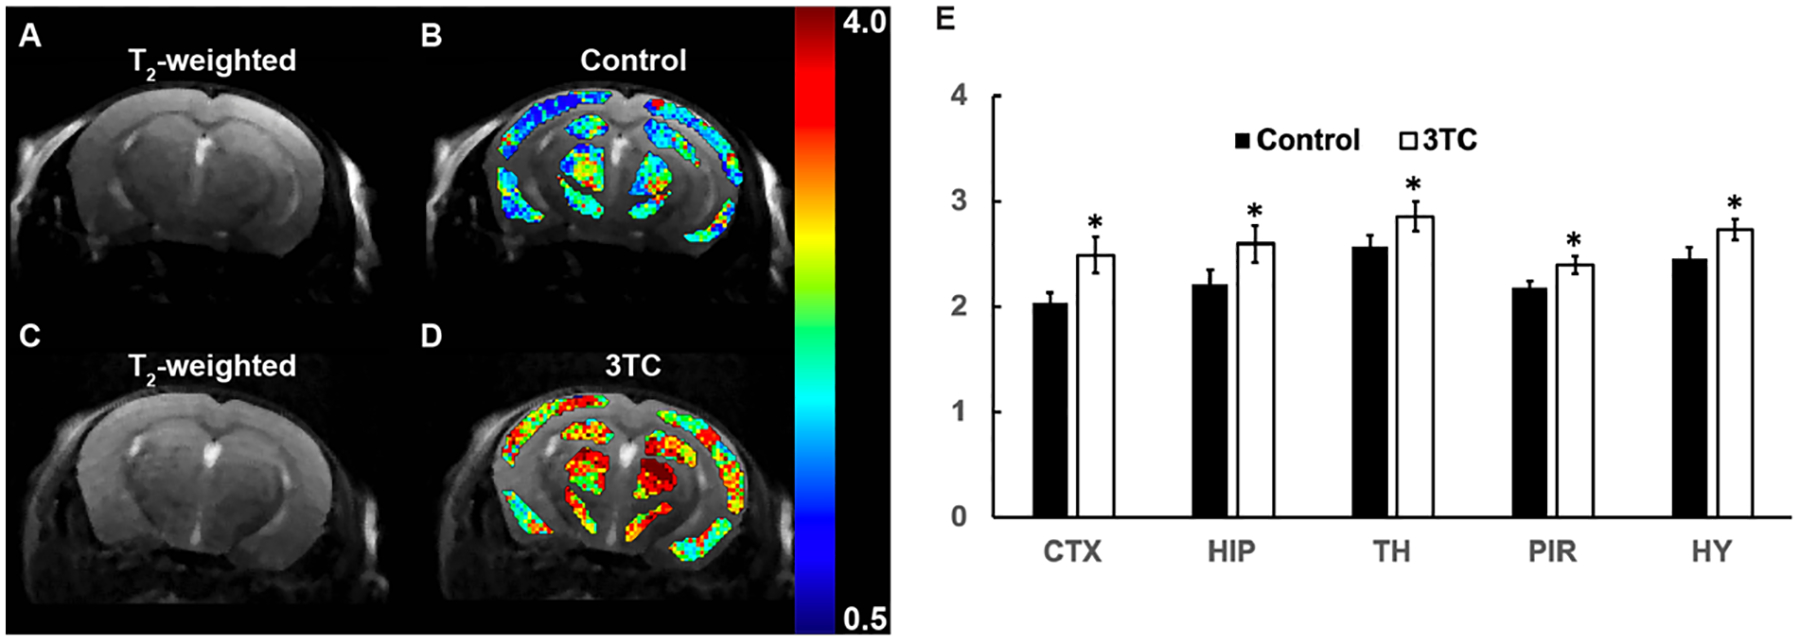
Figure 3.

(A and B) T2-weighted image of a control mouse, and pixel-by-pixel Lorentzian line integral heatmaps of fitted amino proton effect superimposed on the respective T2-weighted image. (C and D) T2-weighted image of a 3TC-treated mouse, and pixel-by-pixel Lorentzian line integral heatmaps of fitted amino protons superimposed on the respective T2-weighted image. (E) Group comparisons of fitted integrals of amino proton chemical exchange saturation transfer (CEST) effect. Student’s t test (two-tailed) was used to compare in vivo CEST imaging results from the control and 3TC groups, *: p < 0.05. Data are expressed as mean ± standard error of the mean (SEM); N = 8 (Control) and N = 7 (3TC)
