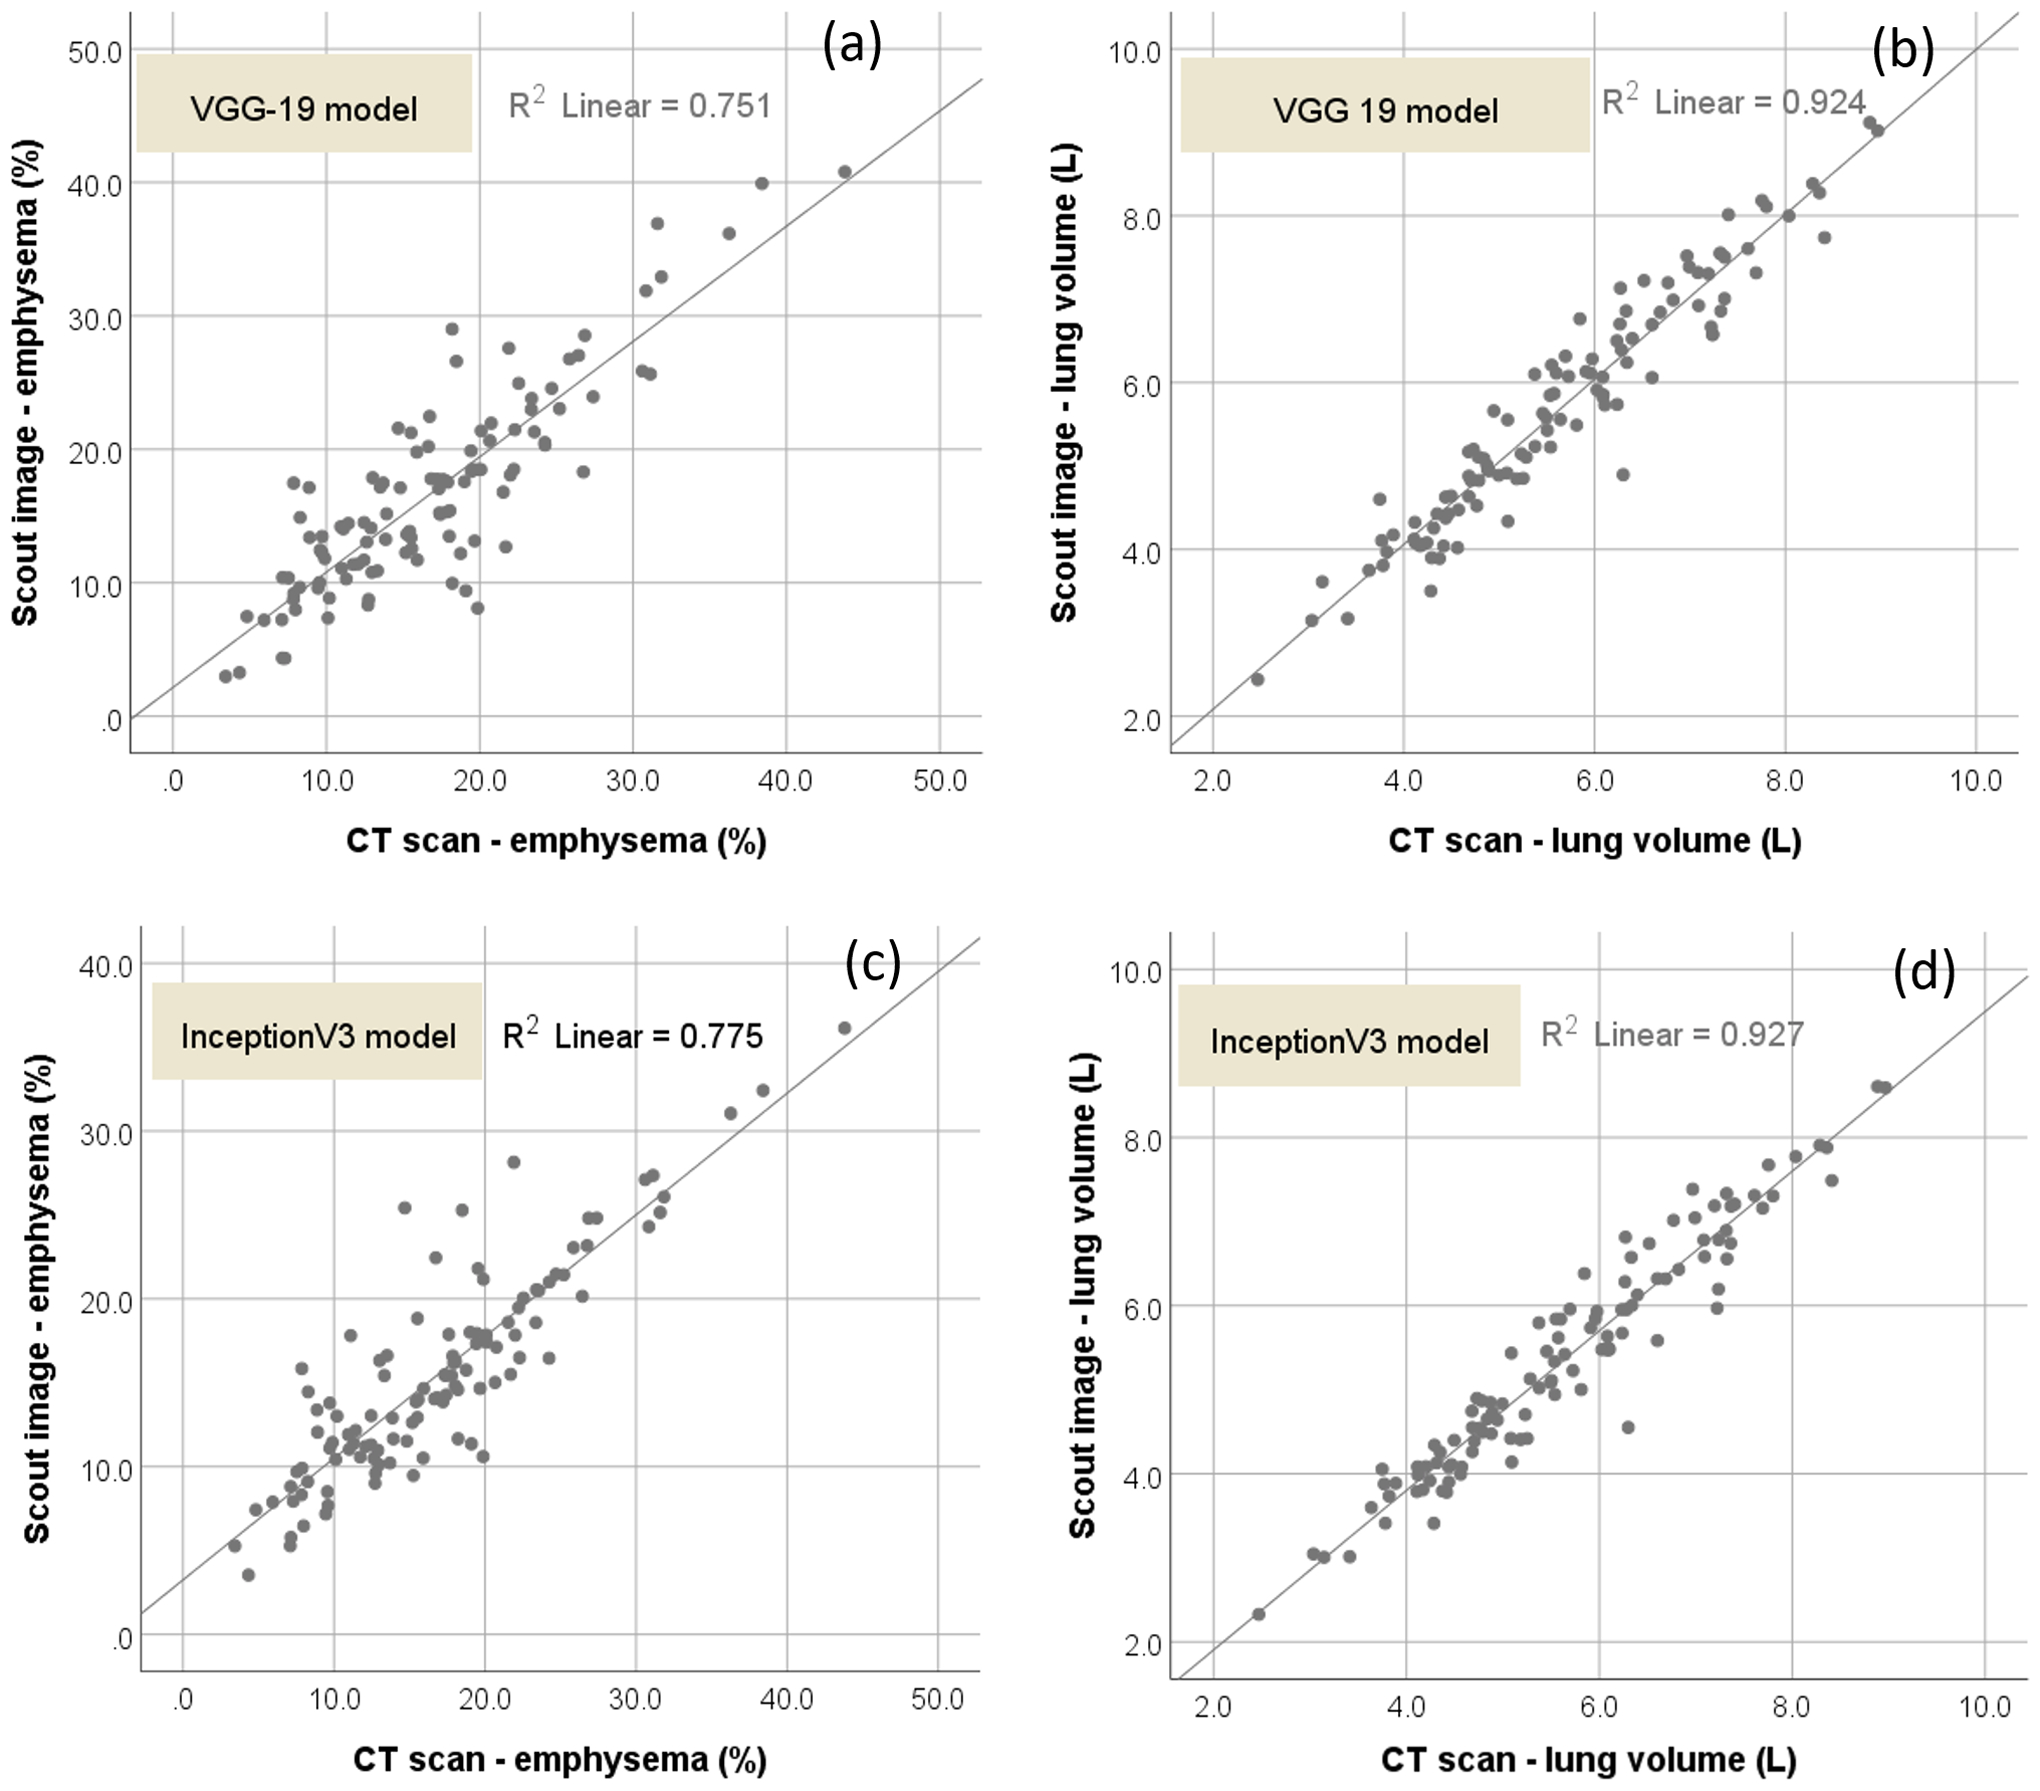
Fig. 1.

Scatter plots of the lung volume and percentage of emphysema computed from CT scans versus scout image with the linear regression lines. (a) and (b) showed the scatter plots by the VGG-19 model, and (c) and (d) showed the scatter plots by the InceptionV3 model.
