
Fig. 5.
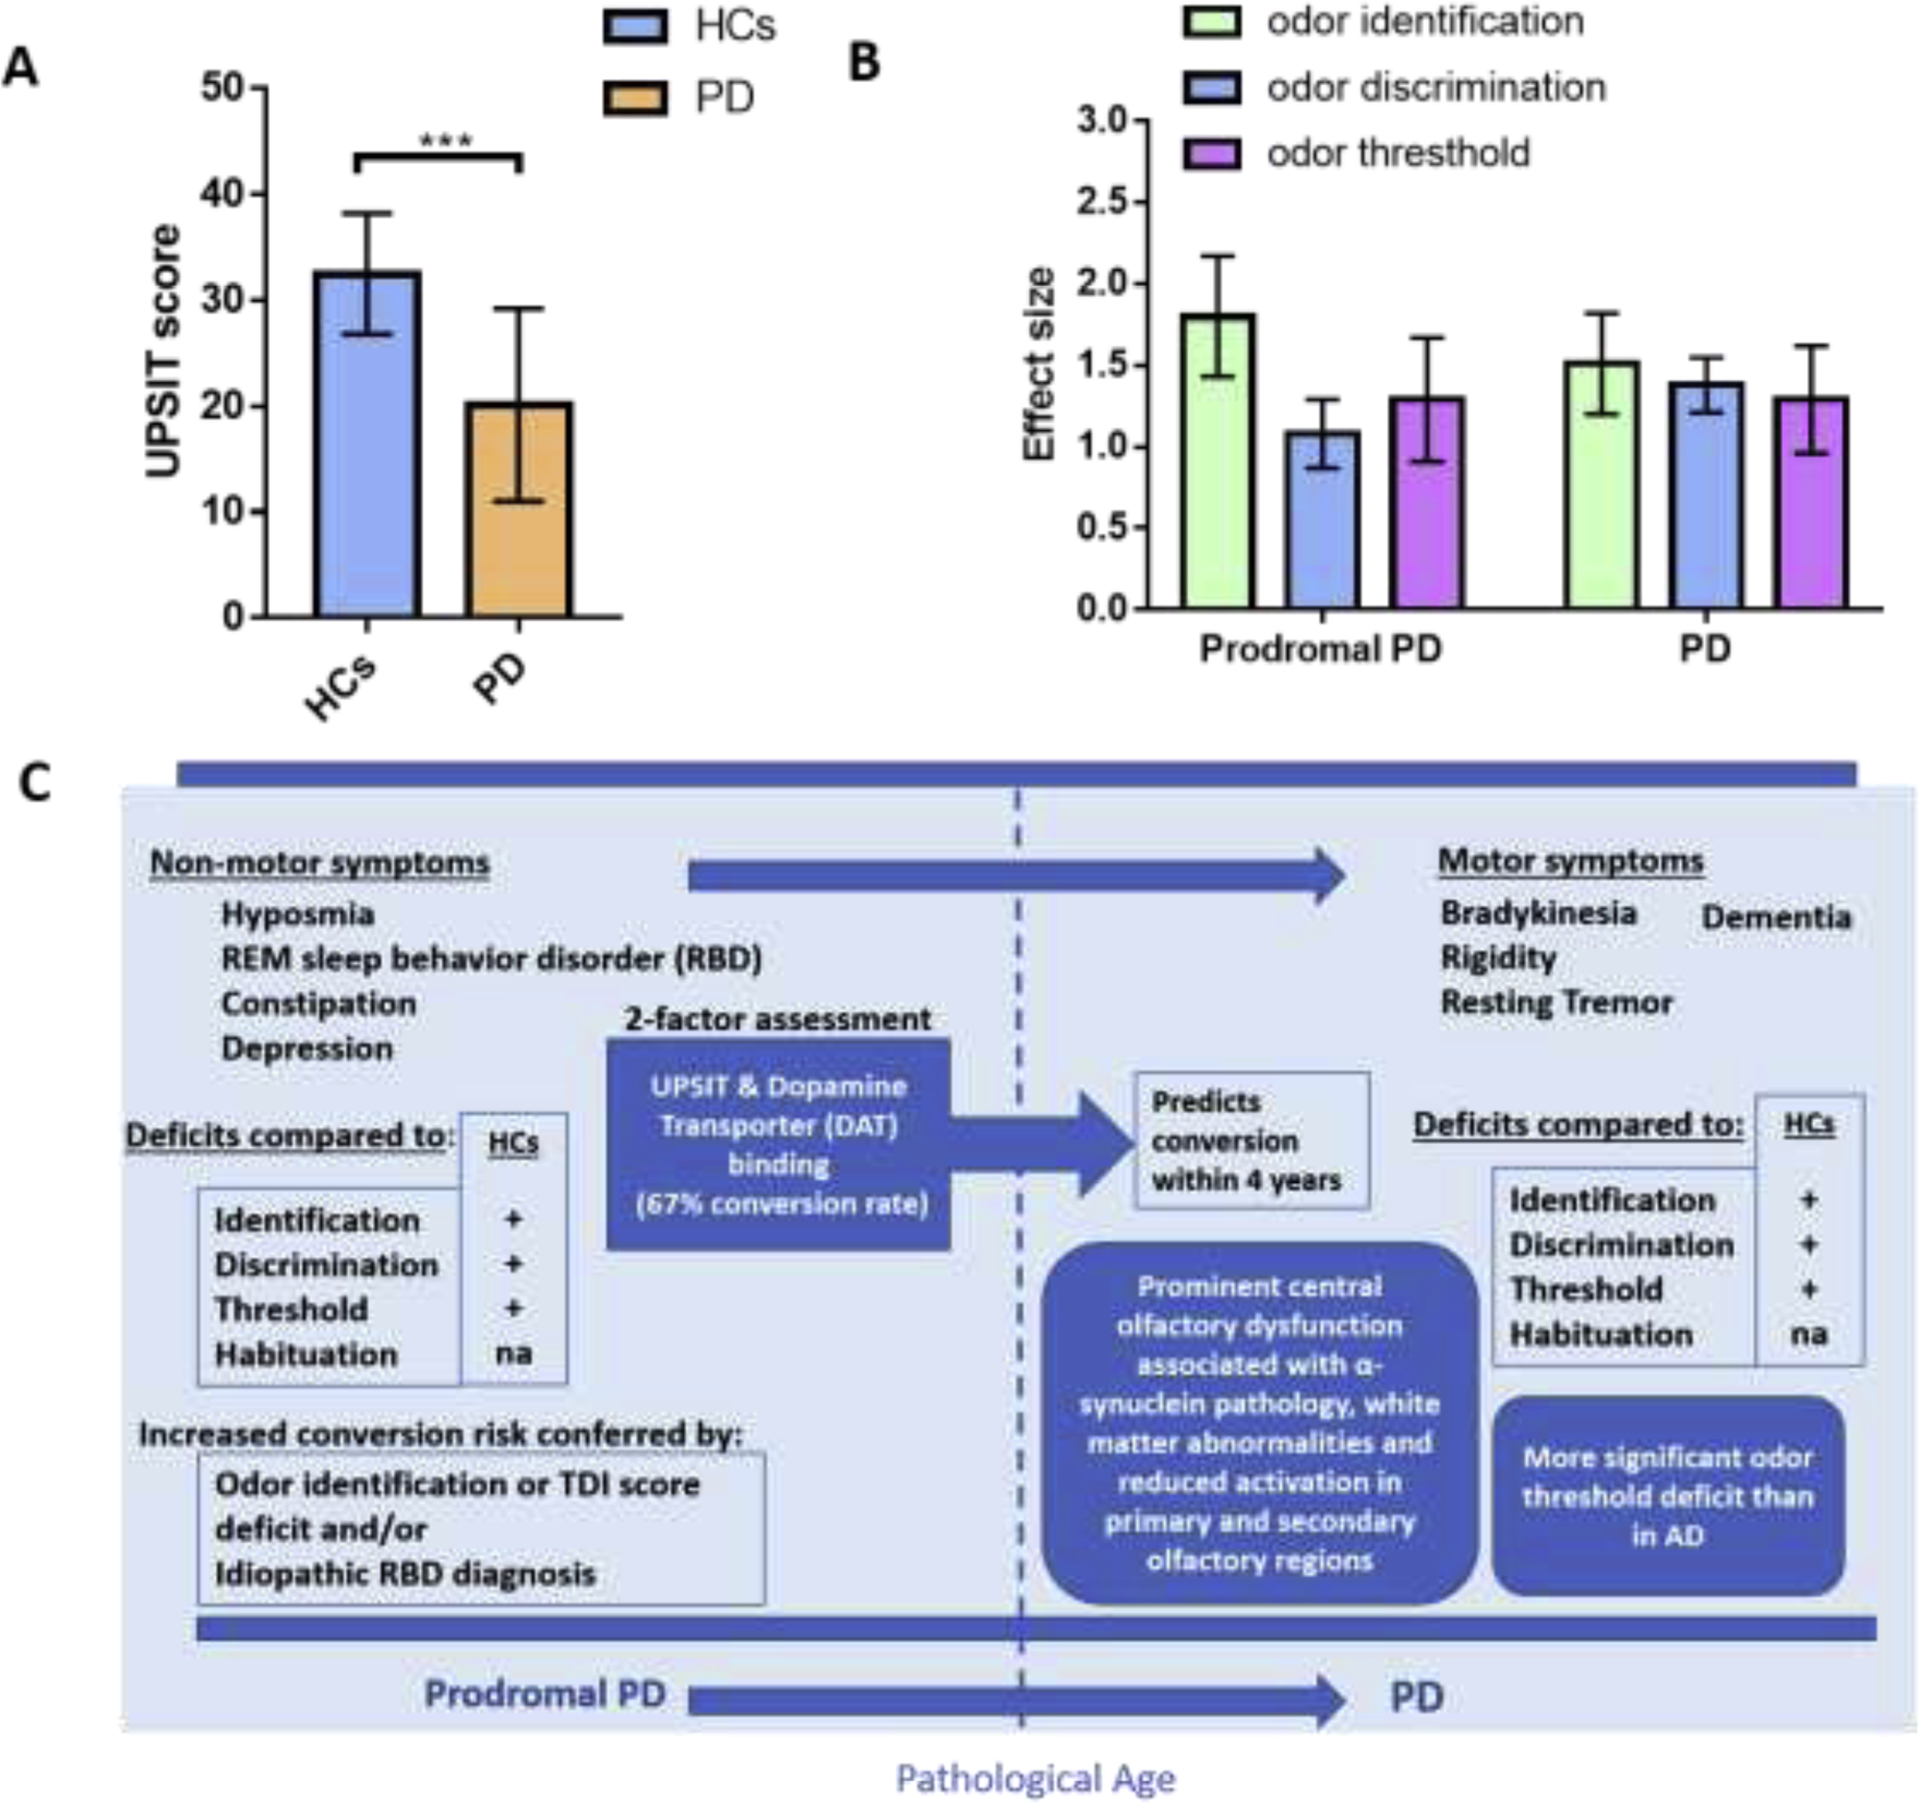
OD in PD. (A) Comparison of odor identification ability between healthy control (HC) and PD patients. Graph plotted based on (Chou and Bohnen, 2009). NC (n=44): 59.6±10.8 years; PD (n=44): 59.3±10.1years. (B) Effect sizes for different olfactory domains in prodromal PD and PD (error bars indicate 95% confidence interval). Prior convention has classified effect sizes as small (d=0.2), medium (d=0.5) or large (d≥0.8). Graph plotted based on 2 meta-analyses (Lyu et al., 2021; Rahayel et al., 2012). (C) Infographic profiles of OD in prodromal PD and PD patients.