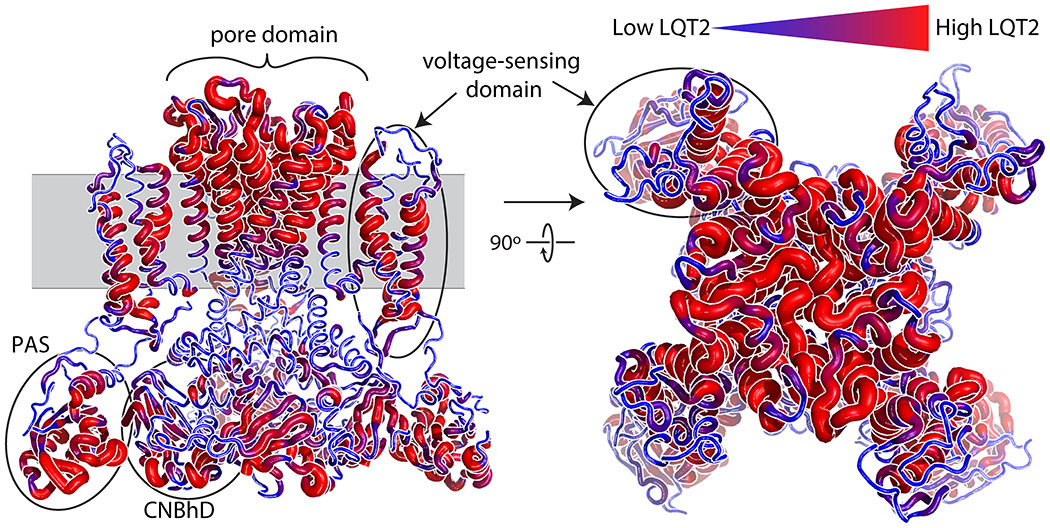
Figure 2.

LQT2 probability density mapped on to KV11.1 structure. LQT2 probability density mapped on to the three-dimensional structure of the KV11.1 channel. Larger and redder segments indicate higher LQT2 probability density; smaller and bluer segments indicate lower LQT2 probability density. The model illustrates structural information regarding amino acids predicted to increase disease probability. Unlike linear graphical displays identifying pathogenic loci, LQT2 probability density provides novel, three-dimensional, insights into the specific structural components of the PAS, CNBhD, voltage-sensing, and pore domains that are associated with increased prevalence of LQT2.
