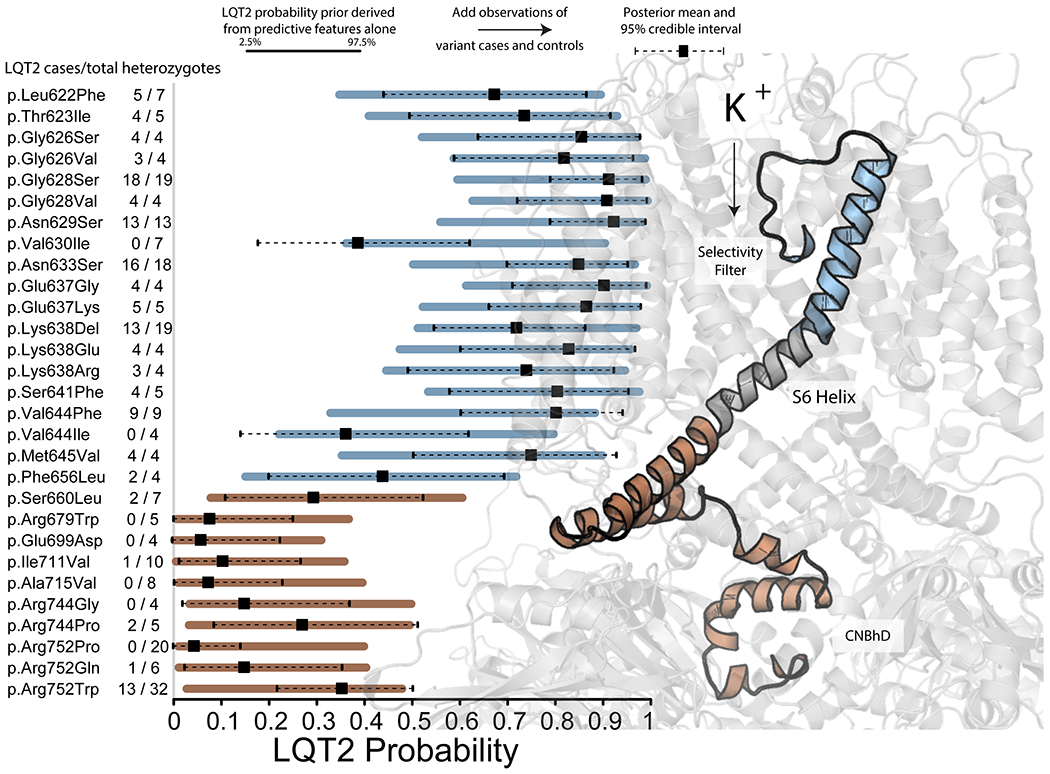
Figure 5.

Example probability predictions for segment of KCNH2 including the selectivity filter and S6 helix. Example probability predictions for segment of KCNH2 including the selectivity filter and S6 helix. Priors were generated from in vitro (when available) and in silico covariates. Bars indicate the 95% interval of the prior. The dot and lines reflect the point estimate and 95% credible interval of the posterior, after the observations of affected individuals and those not meeting the threshold for affected status are included. Number of heterozygotes follows variant name on the left side of the figure. To the right, is a translucent structure of the KV11.1 channel. KV11.1 from p.Ser621 (c.1863) to p.Arg752 (c.2255) is represented as a solid cartoon, with two segments highlighted in different colors. The blue region highlights a segment with higher overall LQT2 probability while the red region highlights a segment with lower overall LQT2 probability.
