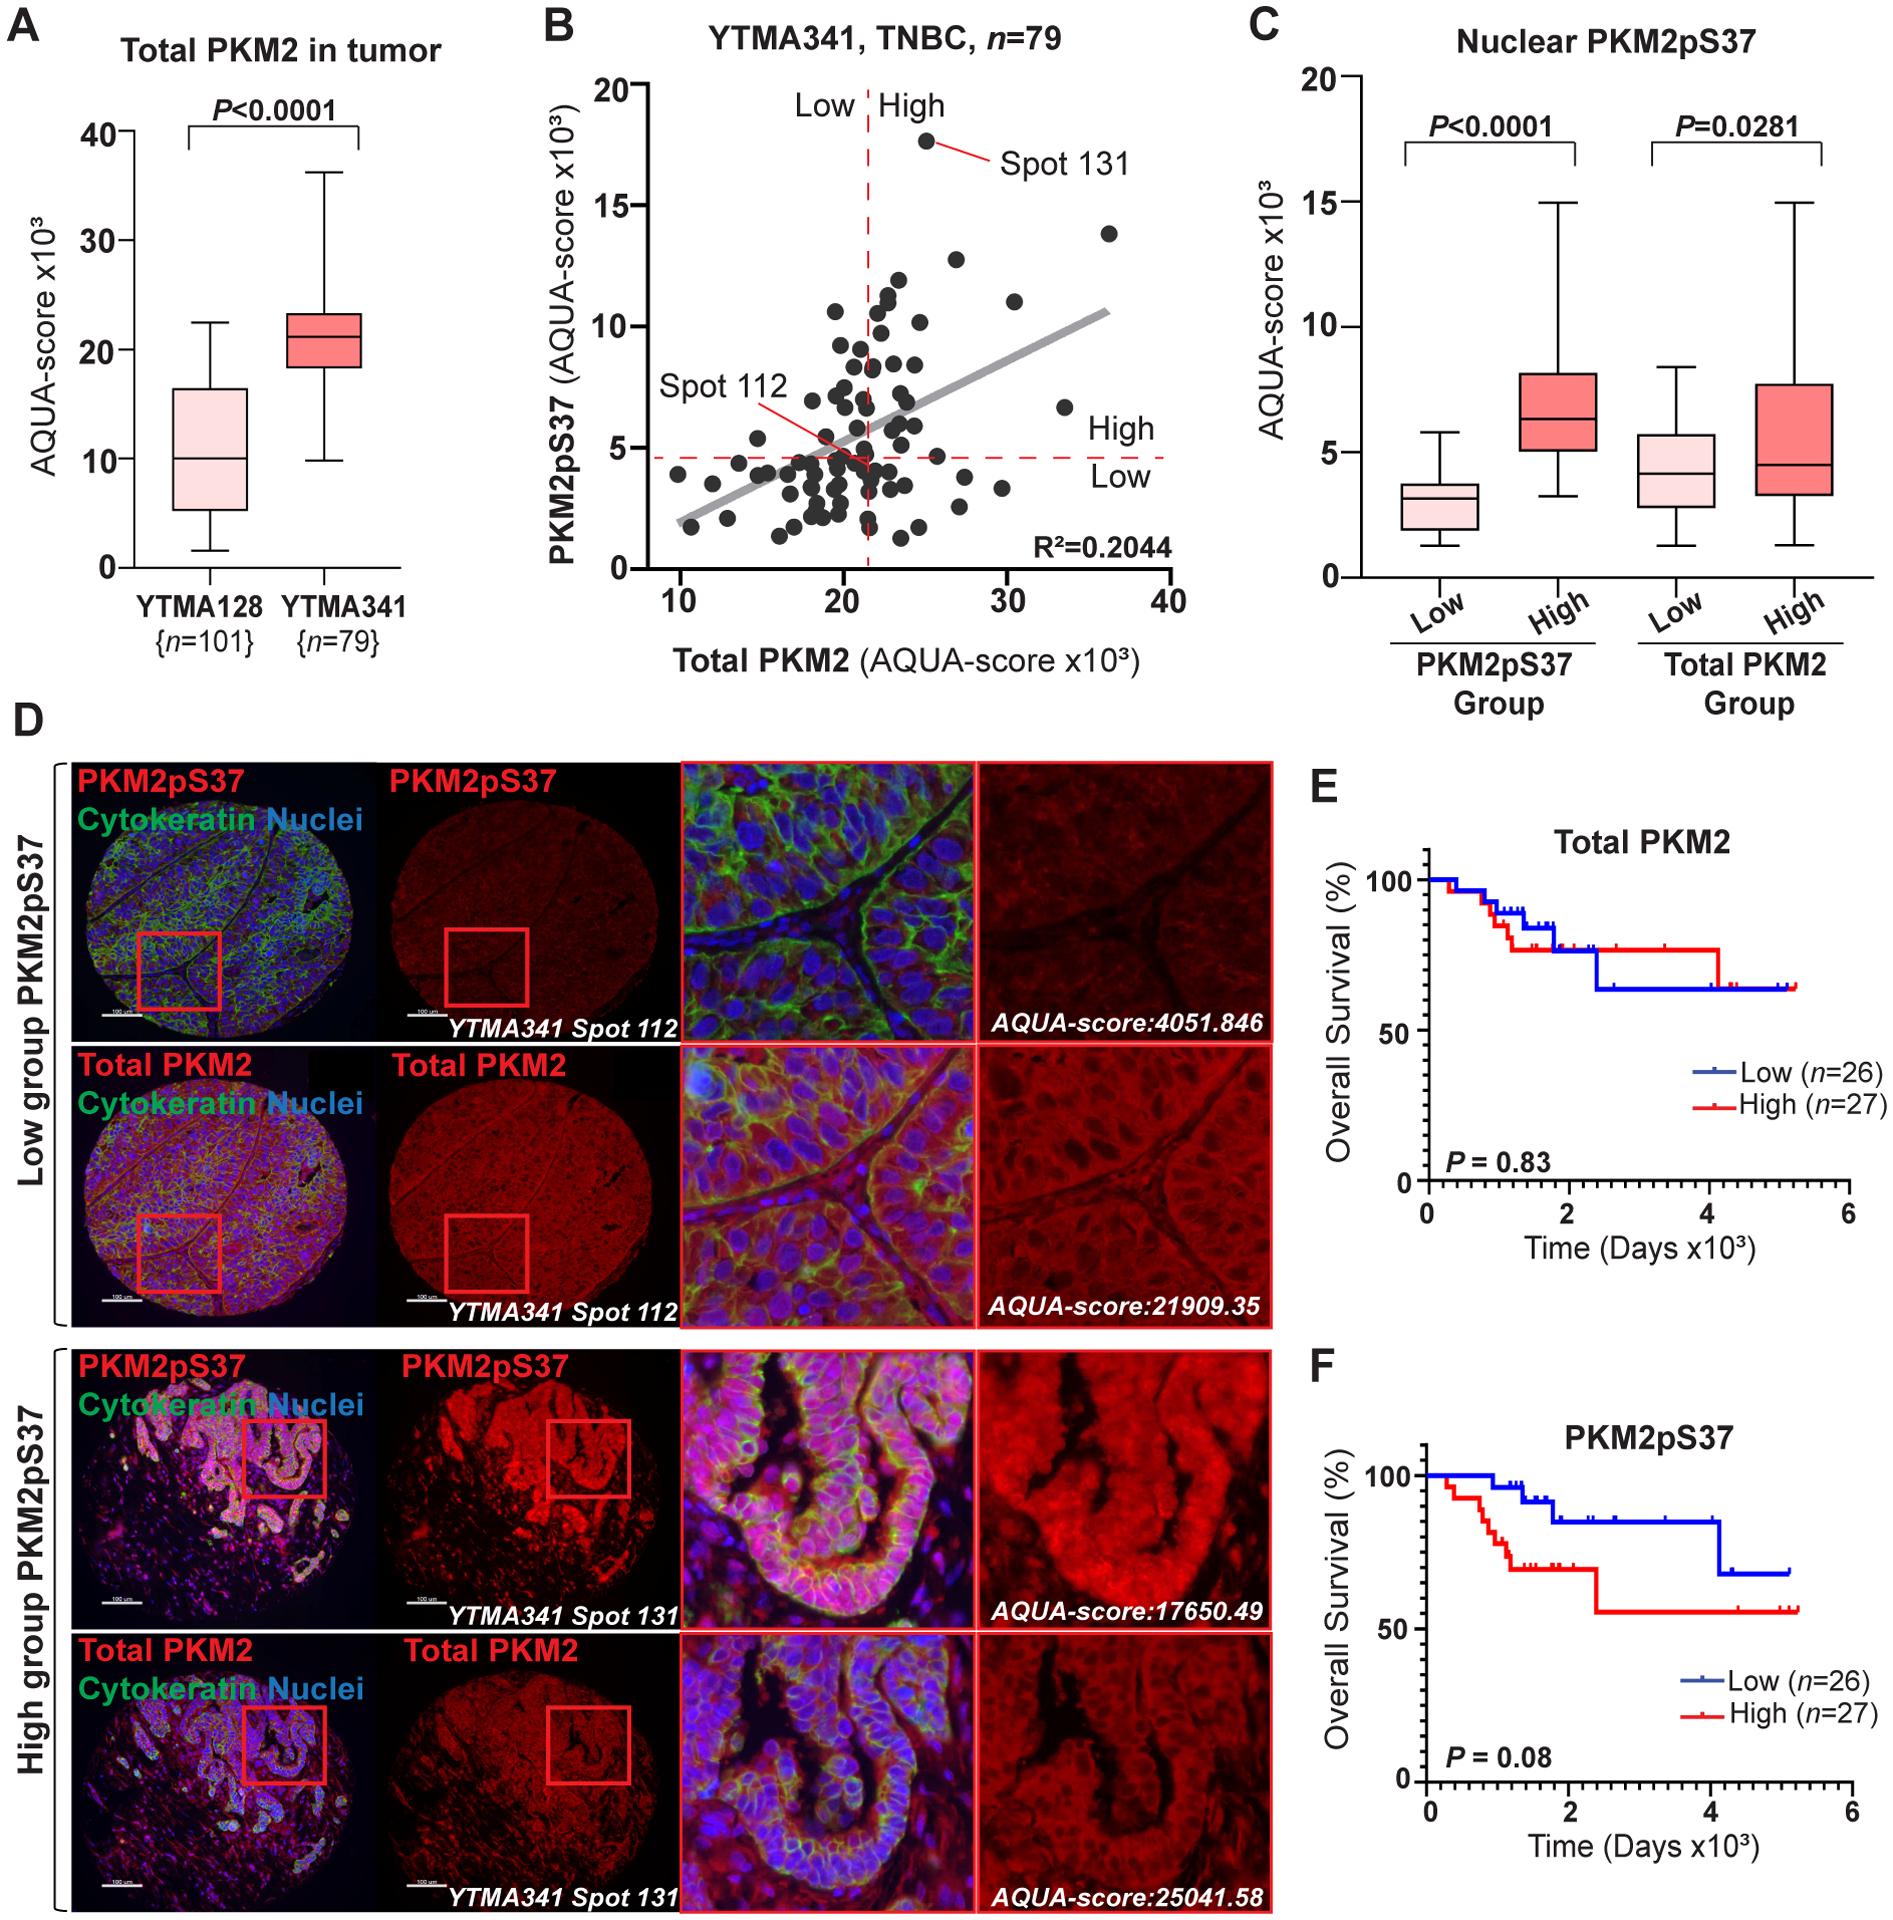
Figure 2:

PKM2pS37 presence in the nucleus correlates with decreased overall survival in TNBC patients. A) Comparison of PKM2 expression in tumor using AQUA scores obtained from YTMA128 (n = 101) and YTMA341 (n = 79) tumor array analysis (t test, ****P < 0.0001). B) Correlation between AQUA (QIF) scores for PKM2pS37 and total PKM2 quantified in tumor mask on each YTMA341 spots. Dashed red lines correspond to median cut-points used for patient Low/High grouping. C) Comparison of nuclear PKM2pS37 expression in tumor between Low- (n = 40) and High- (n = 39) expressing PKM2pS37 or total PKM2 patient groups using AQUA scores obtained from YTMA341 analysis. Significance, one-way ANOVA (Tukey’s HSD). D) Representative YTMA341 spots stained for PKM2pS37 or total PKM2. PKM2pS37 low- (upper panel) and high- (lower panel) expressing patient; Nuclear staining, DAPI (blue); Scale bar, 100 μm. E), F) Kaplan-Meier curves for overall survival with respect to total PKM2 and PKM2pS37 expression. Significance, Log-rank (Mantel-Cox) test.
