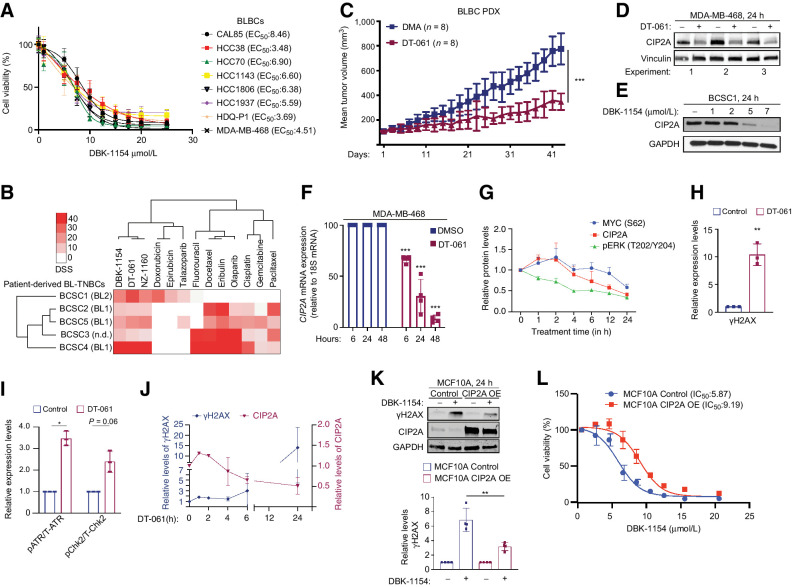
Figure 6.
CIP2A targeting by SMAPs as potential BLBC therapy. A, SMAP (DBK-1154) sensitivity profiles of eight BL-TNBC cell lines. Cell viabilities were measured using CellTiterGlo Luminescence Assay after 24 hours of drug treatment. EC50 values are listed in parentheses. B, Screening of patient-derived BLBC stem cell like cells for chemotherapy and SMAP responses. Heatmap indicates the drug sensitivity scores (DSS) of these cells across standard chemotherapeutics and three SMAPs (DBK-1154, DT-061, NZ-1160). Higher DSS value indicates higher sensitivity. C, Tumor growth of an orthotopic PDX model of basal triple-negative breast cancer treated with DMA or 5mpk BID SMAP DT-061 for 43 days. Respective quantifications are represented as mean ± SD. D and E, CIP2A Western blots from MDA-MB-468 (D) and patient-derived stem cell-like cells BCSC1 (E) on treatment with indicated SMAPs for 24 hours. DT-061 and DBK-1154 concentration, 20 μmol/L. F, Kinetics of CIP2A mRNA expression from MDA-MB-468 cells after treatment with 20 μmol/L of DT-061. n = 3 expressed as mean ± SD. G, Kinetics of pT202/Y204-ERK, CIP2A, and pS62-MYC from the MDA-MB-468 cell line treated with SMAP DT-061 (20 μmol/L) for indicated time points. Representative Western blot data shown in Supplementary Fig. S8H. n = 3 expressed as mean ± SD. H, Quantification of Western blots of the MDA-MB-468 cell line treated with 20 μmol/L SMAP DT-061 for 24 hours and probed for γH2AX, represented as mean ± SD from n = 3 replicates normalized to the untreated controls. I, Quantification of Western blots from the MDA-MB-468 cell line treated with 20 μmol/L of DT-061 for 24 hours, displayed in Supplementary Fig. S9A. Data expressed as mean ± SD from n = 3 replicates normalized to the untreated controls. J, Time course of CIP2A and γH2AX protein expression in MDA-MB-468 treated with DT-061 (20 μmol/L) for indicated time periods. Western blot data are shown in Supplementary Figs. S8F and S9B. K, CIP2A overexpression in the MCF10A cell line rescues the SMAP-elicited γH2AX activation. Western blots of parental and CIP2A OE MCF10A cells treated with SMAP DBK-1154 for 24 hours and probed for γH2AX. GAPDH is used as loading control; γΗ2AX quantifications from n = 4 replicates displayed below. L, Dose–response curve of control and CIP2A OE stable cell line (CIP2A OE) MCF10A cells on treatment with concentration series of DBK-1154 for 24 hours. IC50 values are indicated in parenthesis. A–L,P values calculated using the unpaired t test, *, P < 0.05; **, P < 0.01; ***, P < 0.001.

