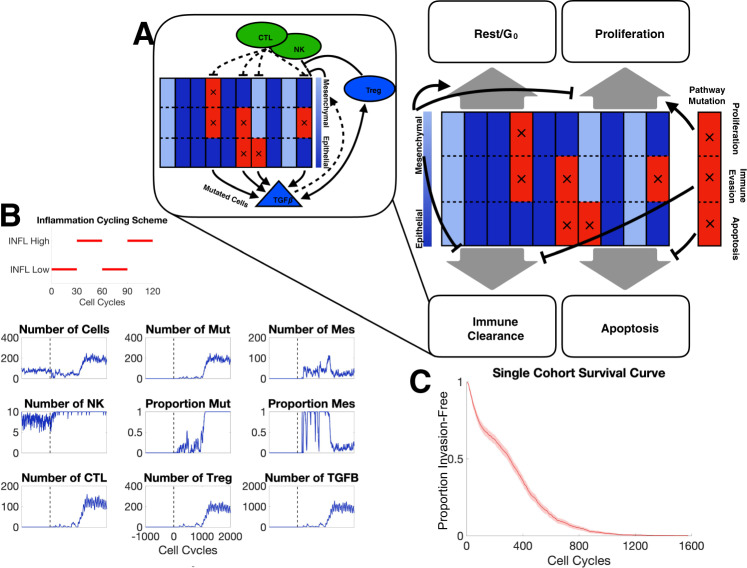
Fig. 1. Overview of model structure and simulation outputs.
A Schematic depiction of agent-based model components; each of the 10 columns represents one tumor cell divided into three compartments representing the state of three pathways with tumorigenic potential; blue/red denotes baseline/altered pathway activity. Black arrows depict cell fate regulation in each cell cycle. Inset depicts major interactions between the immune system and tumor cells. B A representative simulation of one patient. The parameter values used can be found in Table S1. The inflammation cycling scheme (red) is shown above the patient dynamics. The vertical dashed line denotes the end of the warmup period. Mut malignant cells, Mes mesenchymal cells. C Survival curve for one cohort of patients for parameter values given in Table S1.

