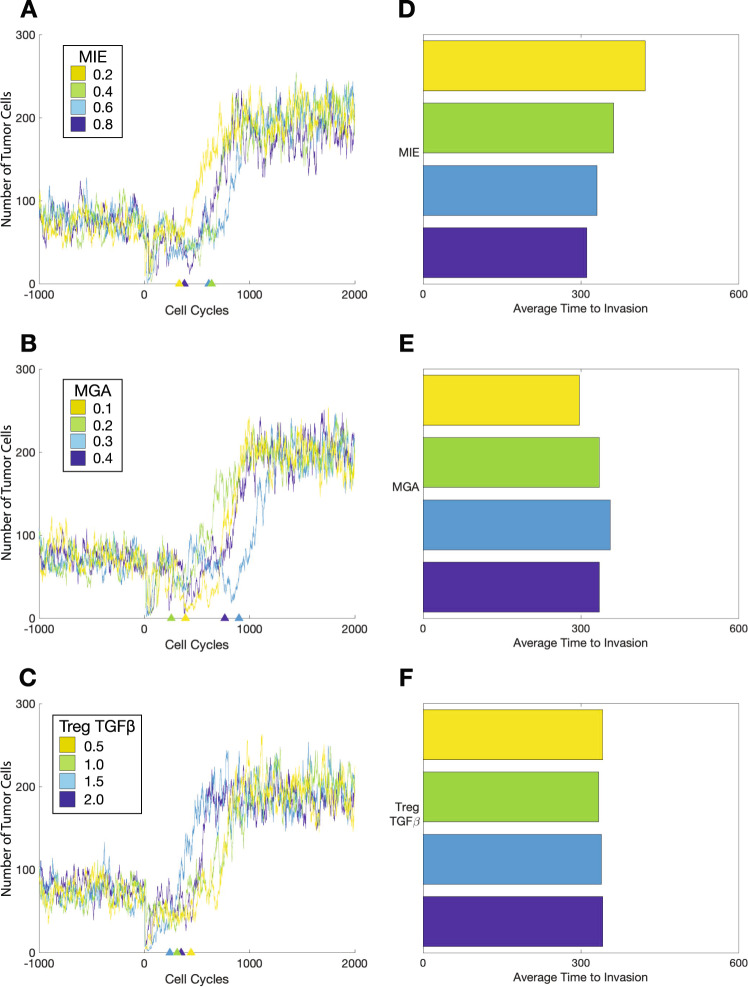
Fig. 3. Effects of mesenchymal tumor cell properties on the time to invasion.
Trajectories of one patient per cohort including warmup and 2000 cell cycles for A mesenchymal immune evasion (MIE); B mesenchymal growth arrest (MGA); C production of TGF-β by Tregs. D Average times to invasion for a patient cohort of 1000 for changes in MIE. E Average times to invasion for a patient cohort of 1000 for changes in MGA. F Average times to invasion for a patient cohort of 1000 for changes in Treg production of TGF-β.

