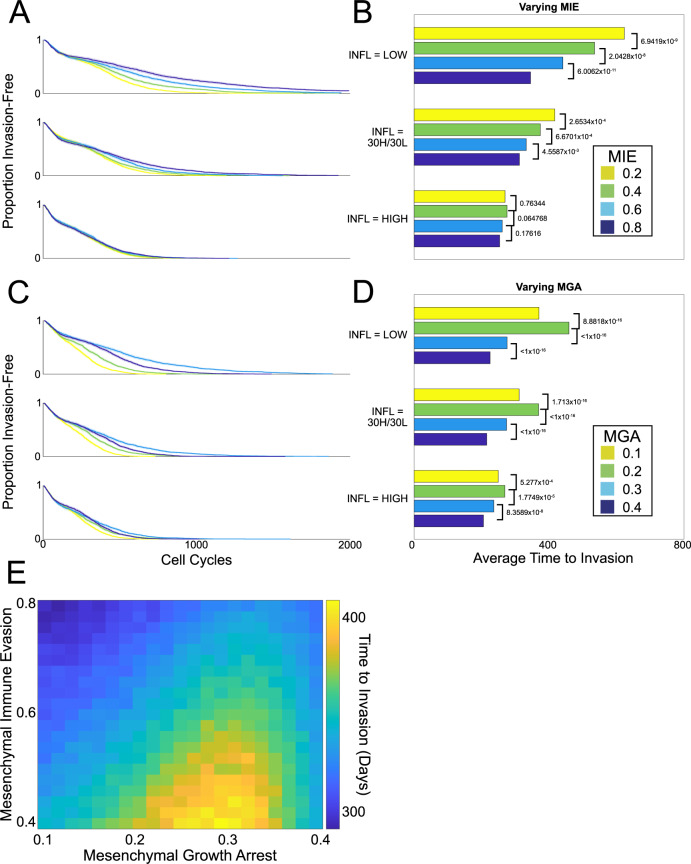
Fig. 4. Effects of inflammation on the time to invasion under different cycling schemes.
A, B As MIE varies, survival curves (each of 200 patients) and corresponding bar plots to summarize the mean time to invasion for each cohort are shown. P values for log-rank tests on the corresponding survival curves are shown. C, D. As MGA varies, survival curves and corresponding bar plots to summarize the mean time to invasion for each cohort are shown. P values for log-rank tests on the corresponding survival curves are shown. E Summary of the effects of MIE and MGA on invasion-free survival.

