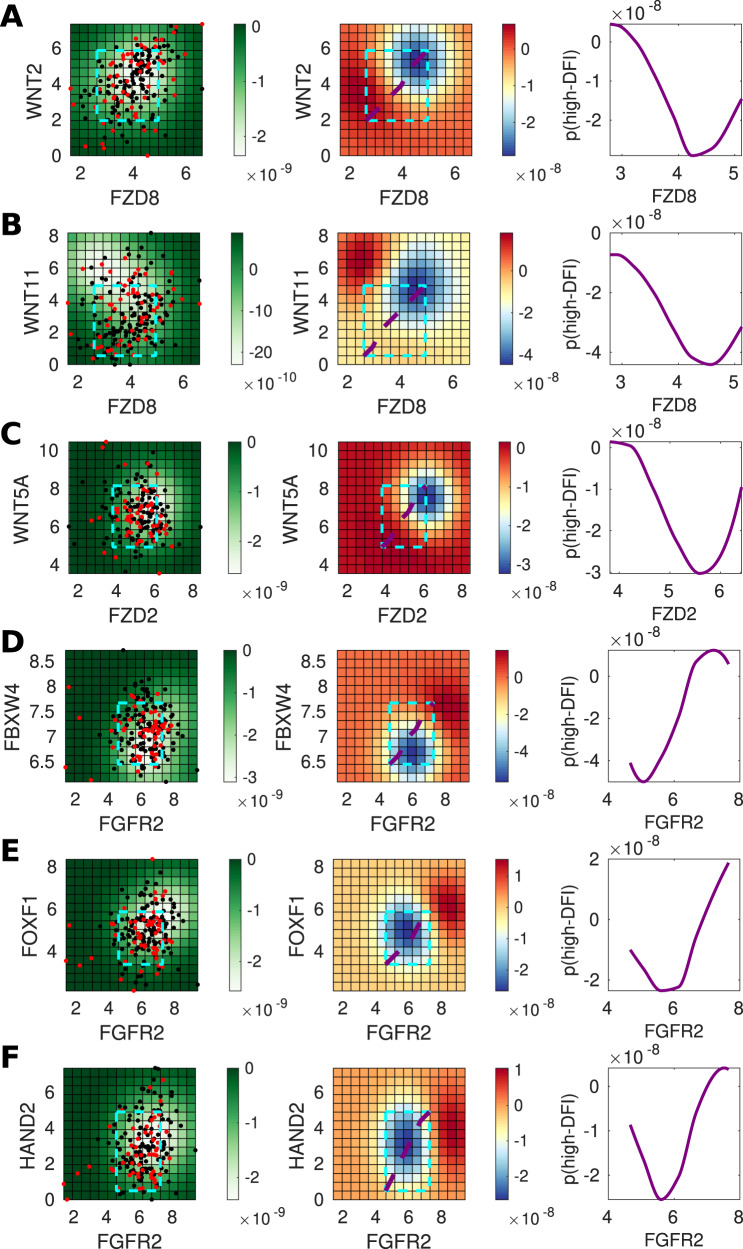
Fig. 5. Genes predictive of invasiveness in BLCA.
A For gene pair WNT2 and FZD8, the left panel shows the posterior variance on log–log expression plot of the predicted probability overlaid with patient samples (red = low-DFI, black = high-DFI), 90% confidence interval box drawn for standardized expression values (cyan); middle panel: posterior log probability of high-DFI over the same region as left, where the diagonal line (purple) shows the co-expression trend (diagonal line through the 90% CI of standardized expression values); right panel: posterior log probability of high-DFI plotted against the expression of FZD8, values simulated along the diagonal (purple) corresponding to the middle panel. B As above for WNT11 and FZD8. C As above for WNT5A and FZD2. D As above for FBXW4 and FGFR2. E As above for FOXF1 and FGFR2. F As above for HAND2 and FGFR2.

