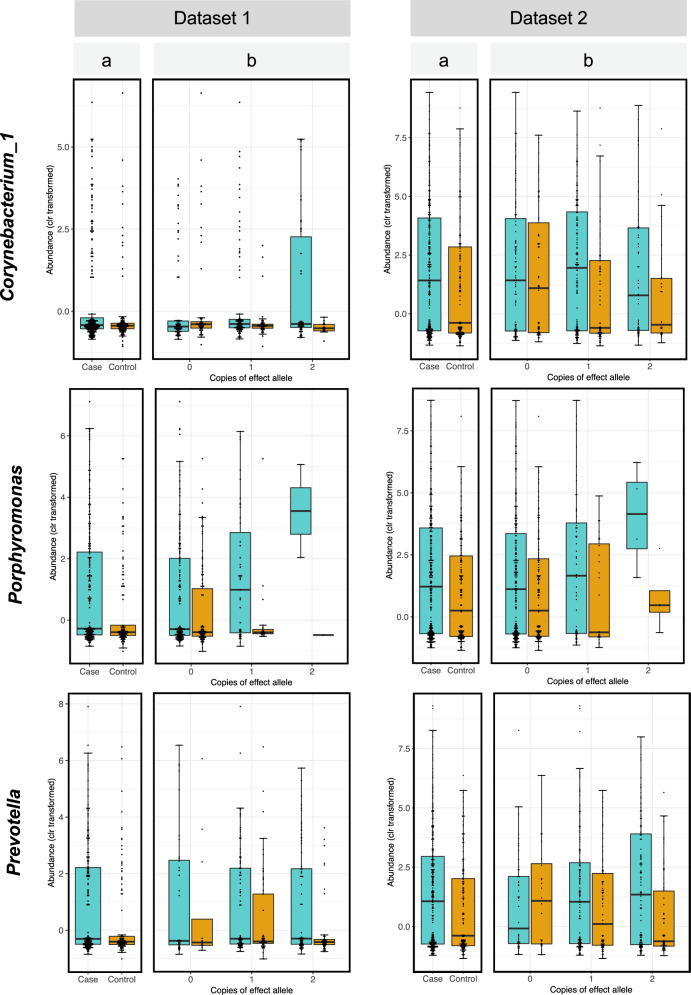
Fig. 2. Differential abundance of opportunistic pathogens.
Clr-transformed abundances of each taxon are plotted for PD cases (blue) and controls (orange) for all subjects irrespective of genotype (panel a) and stratified for the three genotypes of the interacting SNP (panel b). The bottom, middle, and top boundaries of each box represent the first, second (median), and third quartiles of the clr-transformed abundances. Lines extending from the top and bottom of boxes show 1.5 times the interquartile range. Points extending above or below the horizontal caps of the top and bottom lines of each box are outliers. The two datasets show the same pattern of interaction where the difference between PD and controls in the abundances of each taxon becomes larger with increasing number of the effect allele. Dataset 2 has higher resolution than dataset 1 (particularly for Corynebacterium_1 which is rare) because it had 10x greater sequencing depth.

