Figure 6.
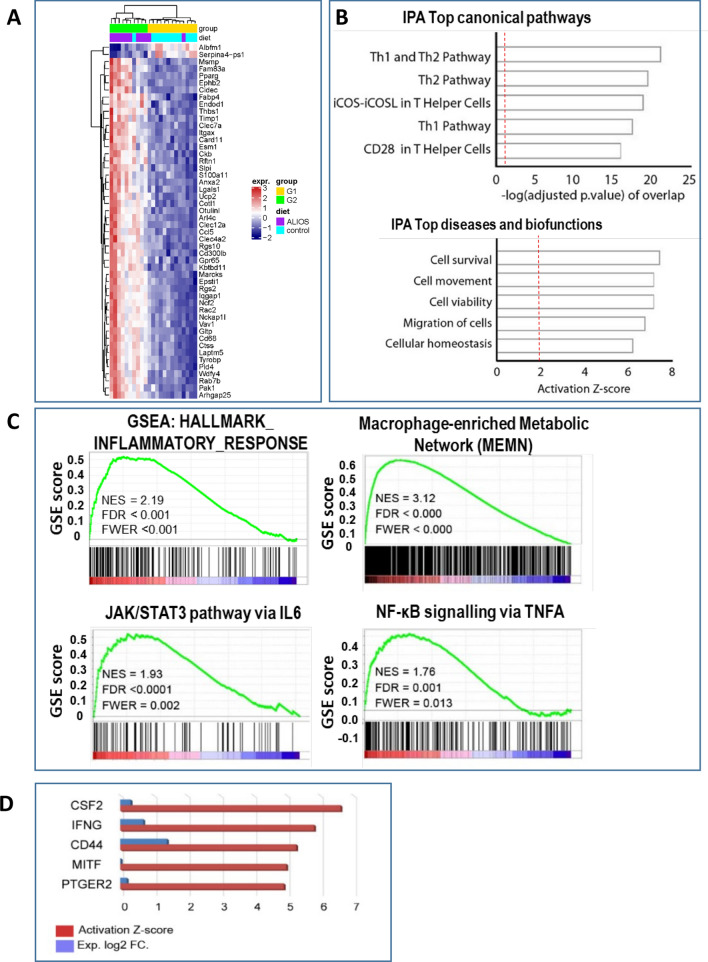
DINAH model transcriptome in NAFLD non-tumour identifies inflammatory pathways, macrophages and CD44 associated with HCC development. The RNA-seq transcriptome heat map, generated after unsupervised clustering analysis of non-tumour (NT) C3H/He, compares the two distinct groups identified (A), where G2 distinguished mice bearing greater number and size of tumours. Ingenuity pathway analysis (IPA) of the differentially expressed (DE) genes identified top canonical pathways ranked according to the-log adjusted p-value, or top diseases and bio-functions activation score (B). Gene Set Enrichment Analysis (GSEA) highlighted and inflammatory response signatures, the Macrophage enriched metabolic network, NF-κB and JAK/STAT3 pathways (C) as enriched in G2 mice. Considering the top IPA upstream regulators of the non-tumour G2-G1 transcriptomic profile, CD44 was ranked third among activated regulators (red) and was the one with the highest differential expression (DE) (blue) (D). Key: NES—normalised enrichment score; FDR—false discovery rate adjusted value; FWER—family-wise error rate.

