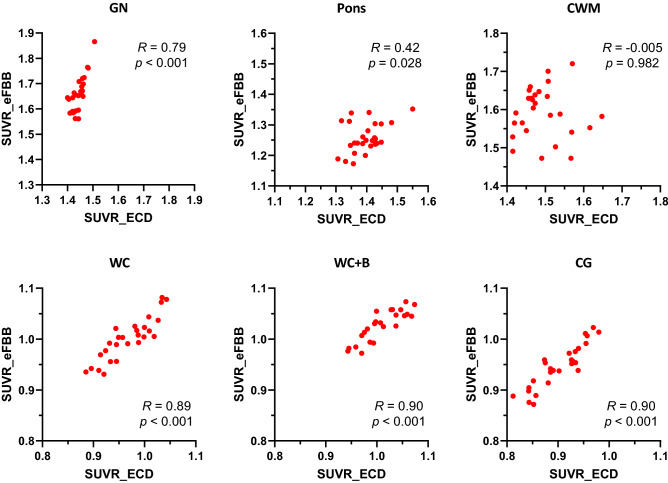
Figure 3.
Correlation plots for the Centiloid cortex volume of interest-based SUVR of ECD SPECT versus eFBB PET based on the six reference regions. Pearson’s coefficient r and p values are shown on each plot. Abbreviations CG, cerebellar grey; ECD, Tc-99m ethyl cysteinate dimer single photon emission computed tomography; CWM, central white matter; eFBB, early-phase F-18 Florbetaben positron emission tomography; GN, Global normalization; SUVR standardized uptake value ratio; WC, whole cerebellum; WC + B, whole cerebellum and brain stem.

