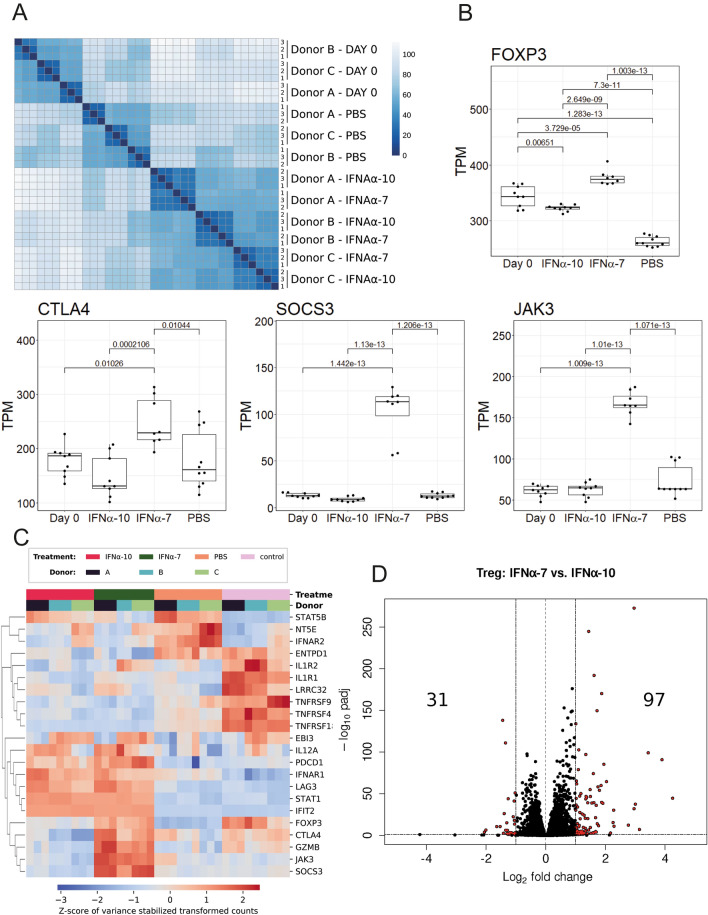
Figure 4.
Transcriptomics reveal distinct activation profile for IFNα-7 compared to IFNα-10. (A) Heatmap of the sample-to-sample euclidean distances for the RNA samples, based on variance stabilised counts data. (B) Expression analysis (TPM) shows that FOXP3, CTLA4, SOCS3 and JAK3 genes were upregulated when comparing IFNα-7 treated to IFNα-10 treated cells. (C) Heatmap showing differences in expression between samples for genes mentioned in the results section. Values were based on transformed count data (variance stabilising transformed) extracted from DESeq2 with its vst function and with blind set to FALSE. Z-scores were subsequently applied to accentuate differences between samples. (D) Differentially expressed genes (twofold change and FDR < 0.05) when comparing IFNα-7 and IFNα-10 treatments of Treg cells; 97 genes were significantly upregulated and 31 genes were downregulated with this threshold. Heatmap of the sample-to-sample euclidean distances for the RNA samples, based on variance stabilized counts data. Treg cells from 3 individual donors were analysed in the transcriptomics experiments in 3 replicates from each individual donor.

