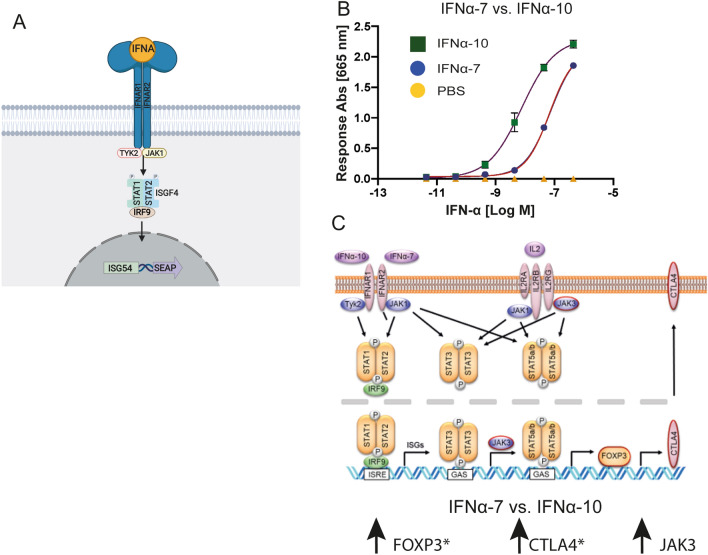
Figure 5.
Suggested model of IFNα-7 vs IFNα-10 strengthens difference in ISG transcription signaling. (A) Schematic representation of HEK293 reporter cell line for IFNAR1/2 mediated JAK STAT1/2 signaling leading to ISG transcription of secreted embryonic alkaline phosphatase. (B) Dose–response curves of HEK293 reporter cell line upon treatment with either IFNα-7 (blue circles) or IFNα-10 (green squares), SEM error bars based on n = 2, duplicate measurements and subtracted baseline signal (PBS). (C) A pathway map showing signaling pathways for the IFNAR1/IFNAR2 receptor and the IL-2 receptor. Genes in red are upregulated when comparing IFNα7-treated versus IFNα10-treated cells. JAK3 is significantly upregulated (FDR < 0.05 and > twofold upregulation). * indicates additional phenotypic readouts at a protein level in the primary assay. The observed differences between IFNα-7 and IFNα-10 are further discussed in the main text.

