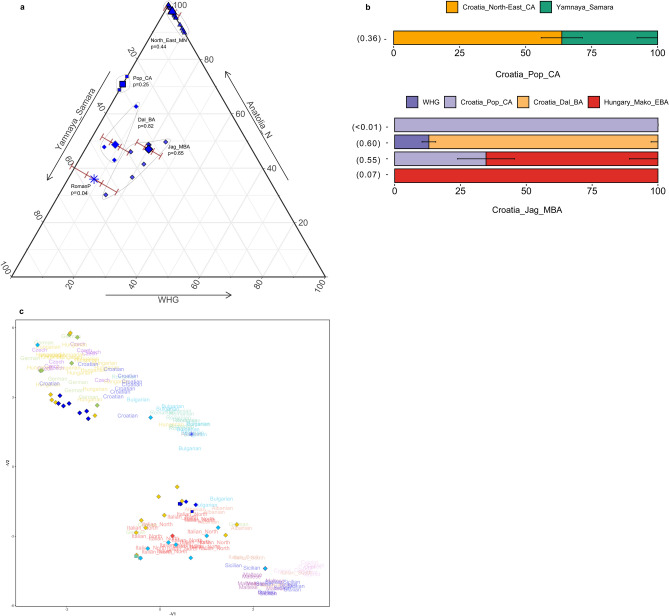
Figure 3.
Admixture and genetic affinities in ancient Croatian genomes. (a) Distal admixture models obtained with qpAdm for ancient Croatian genomes (Source data in Supplementary Table S4). Smaller points represent individuals and larger points represent population groups with one and three standard error bars indicated for the WHG component. Each population group is labelled with its p-value and the group is encircled for clarity. Croatia_North-East_MN results are for nested two-way models with sources WHG and Anatolia_N, Croatia_Pop_CA is modelled with Anatolia_N and Yamnaya_Samara, and the remainder are three-way models using sources WHG, Anatolia_N and Yamnaya_Samara. b) Proximal admixture models for Croatia_Pop_CA and Croatia_Jag_MBA using qpWave and qpAdm (Source data in Supplementary Table S4). Error bars are one standard error in each direction. (c) UMAP plot of selected post-Neolithic genomes from southern and central Europe. Present-day populations from the Human Origins dataset are indicated with text; ancient genomes are indicated with points as per PCA symbols in Fig. 2. All plots were produced using R 3.5.2102.

