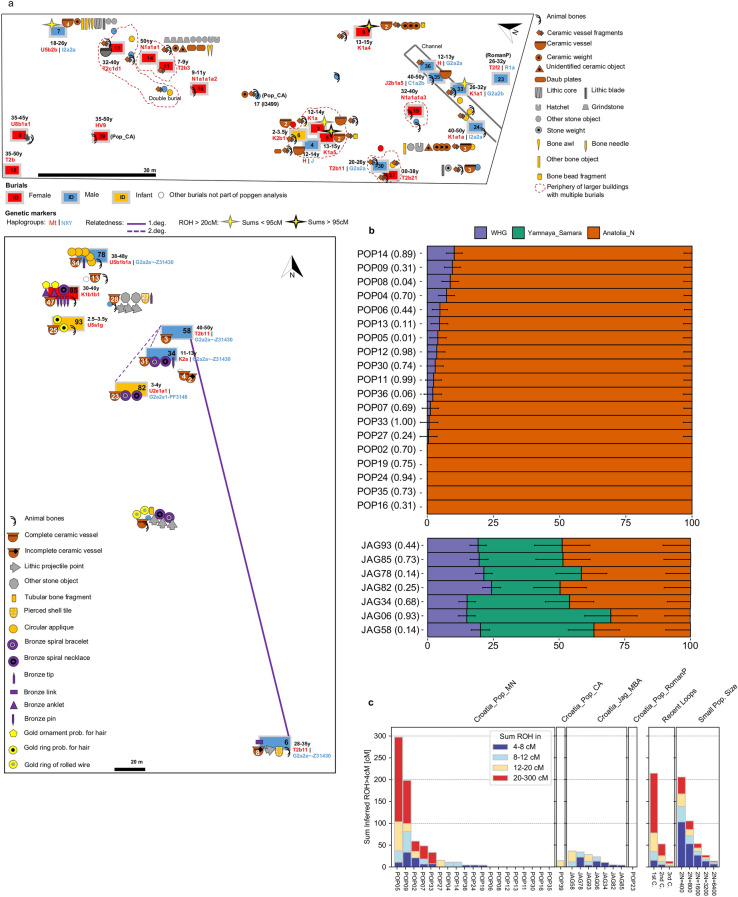
Figure 4.
Burials and individual measures of genetic variation. (a) Plan of Popova zemlja (top) and Jagodnjak necropolis (bottom) showing inhumations, grave goods and demographic information. Burials with increased translucency indicate these were not sampled due to poor preservation or uncertain context. Burials without a fill colour indicate preservation was too poor for sex estimation. Number of grave good objects exceeding one are indicated. Estimated age at death is indicated as a range in years (y) for individuals included in population genetic analysis. Individuals with an estimated age at death of under 8 years are indicated as infants. (b) Stacked bar plots showing distal admixture models calculated with qpAdm for individuals from Croatia_Pop_MN (top) and Croatia_Jag_MBA (bottom), with p-values stated in brackets. Nested two-way models between WHG and Anatolia_N are shown for Croatia_Pop_MN. Three-way admixture models between WHG, Anatolia_N and Yamnaya_Samara are shown for Jagodnjak. Standard error bars are shown as one standard error in each direction (Source data in Supplementary Table S4). Plot produced using R 3.5.2.102 (c) Sums of inferred runs of homozygosity (ROH) greater than 4 cM calculated for each individual with hapROH (Source data in Supplementary Table S10). “Recent loops” and “Small Pop. Size”, generated by hapROH, show the expected distribution of ROH from simulated data for close parental relationships (C = cousin) and small effective population sizes respectively. Plot produced using R 3.5.2102.

