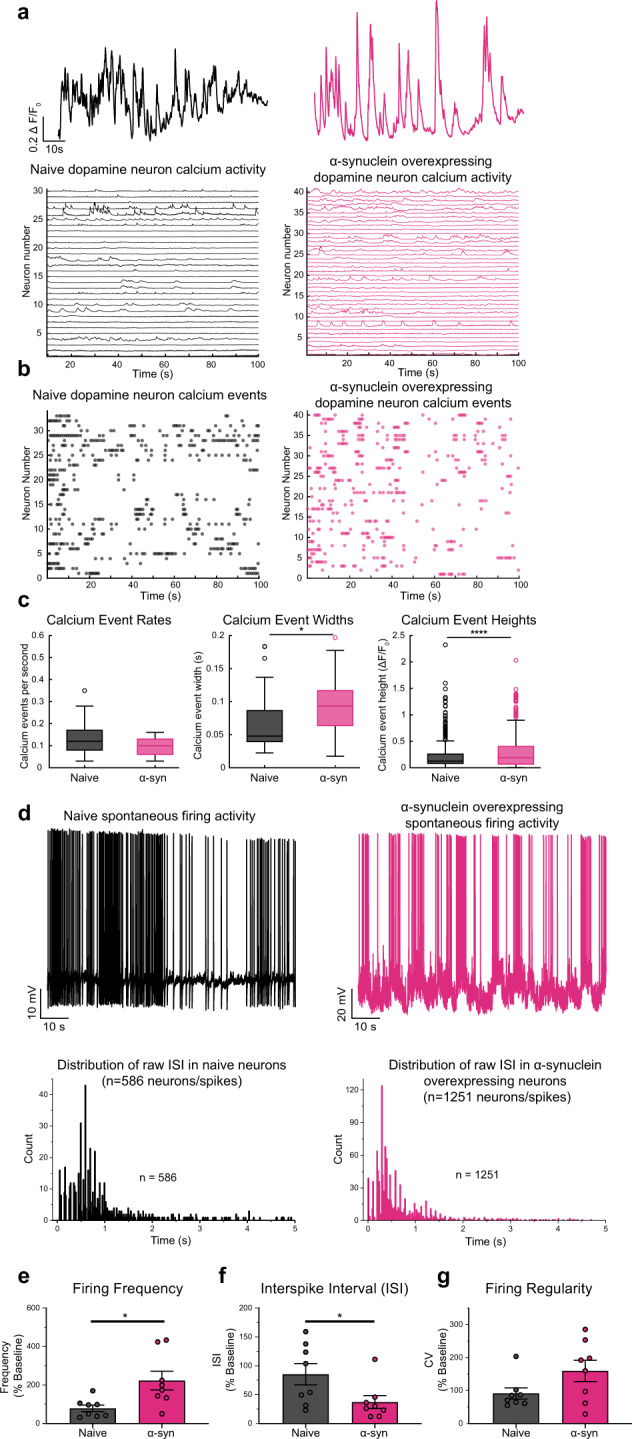
Fig. 2. Overexpression of α-synuclein disrupts calcium dynamics and firing activity of dopaminergic neurons.

a (Top) Representative spontaneous calcium activity in naive dopaminergic neurons (left, black) and dopaminergic neurons overexpressing α-syn (right, pink) exemplify the alteration in calcium dynamics due to increased levels of α-syn. (Bottom) Spontaneous calcium activity encompassing all neurons recorded in each experimental group (n = 33 wild-type neurons, n = 40 α-syn-overexpressing neurons, form eight biological replicates). b Calcium events in all neurons. c Spontaneous calcium event rate, width, and amplitude. Overexpression of α-syn does not alter calcium event rate (two-tailed unpaired t test, WT vs. α-syn, p = 0.1775, n = 33 wild-type neurons, n = 40 α-syn-overexpressing neurons), α-syn burden broaden calcium events (p = 0.0152, two-tailed unpaired t test, WT vs. α-syn, n = 33 wild-type neurons, n = 40 α-syn-overexpressing neurons) and increases in amplitude (p = 0.0000198, two-tailed unpaired t test, WT vs. α-syn, n = 33 wild-type neurons, n = 40 α-syn-overexpressing neurons). d Representative whole-cell current-clamp recordings of spontaneously active naive (top left, black) compared with overexpressing α-syn dopaminergic neurons (top right, pink). Distribution of raw interspike intervals (ISIs) in naive (bottom left) and α-syn-overexpressing neuron (bottom right) (raw ISI distribution, Kolmogorov–Smirnov test, D = 0.26529, p < 0.001). e Naive compared with α-syn-overexpressing dopaminergic neurons (firing frequency: from eight independent experiments, 100 ± 21.21 for naive neurons vs. 281.7 ± 61.30 for α-syn-overexpressing neurons, two-tailed unpaired t test, p = 0.0142; f interspike interval (ISI): 100 ± 21.63 for naive neurons compared to 43.55 ± 13.28 for α-syn-overexpressing neurons, two-tailed unpaired t test, p = 0.0431) and g firing regularity trend in bursts with intermediated periods of quiescence (CV of ISI—100 ± 18.59 for naive neurons vs. 174.9 ± 35.20 for α-syn-overexpressing neurons, two-tailed unpaired t test, p = 0.0808). Empty circles in panel c represent statistical outliers included in the analyses. Bar graphs ± SEM are overlaid with individually filled data points. *p < 0.05; ****p < 0.0001.
