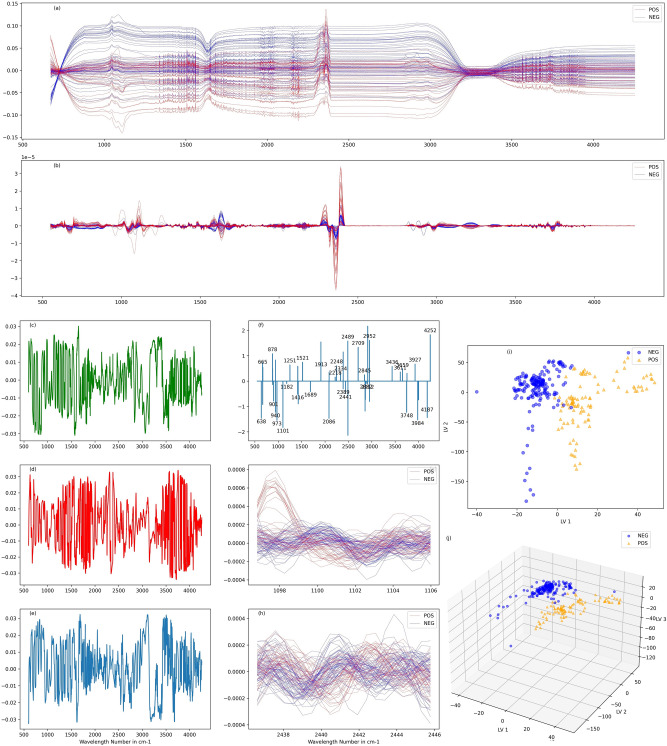
Figure 3.
Detection of SARS-CoV-2 with multivariable analysis. (a) Raw Spectra (b) Sample of 2nd derivative of Savitzky–Golay smoothened spectra of positive and negative samples. (c, d, e) First three latent variables of PLS-DA. (f) Coefficients of variables selected by sparse classification algorithm of second derivative of raw spectra (g, h) Zooms on regions indicated by sparse classification. (i)Projection of the 280 spectra used according to the first two latent variables obtained. (j) Projection of the 280 spectra used according to the first three latent variables obtained.

