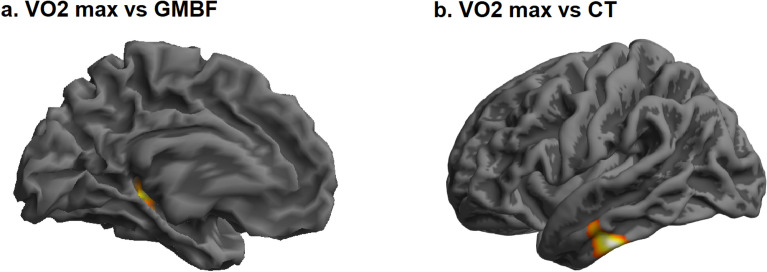
Figure 3.
Association between VO2max and brain measures. The figure shows the clusters were a statistically significant association was detected between VO2max and (a) GMBF and (b) CT, respectively. (a) VO2max was negatively associated with GMBF of the left hippocampus (p FEW-corr = .0003, t = 5.64, MNI coordinates (x, y, z): −36, −34, 4). (b) VO2max was, on the other hand, positively associated with the CT of the left superior temporal gyrus (STG) (p FWE-corr = .006, t = 5.18, MNI coordinates (x, y, z): −56, −21, −3). Clusters were superimposed on a surface rendering in SPM12. The Harvard–Oxford Cortical Structural Atlas was used to derive the location of the coordinates.

