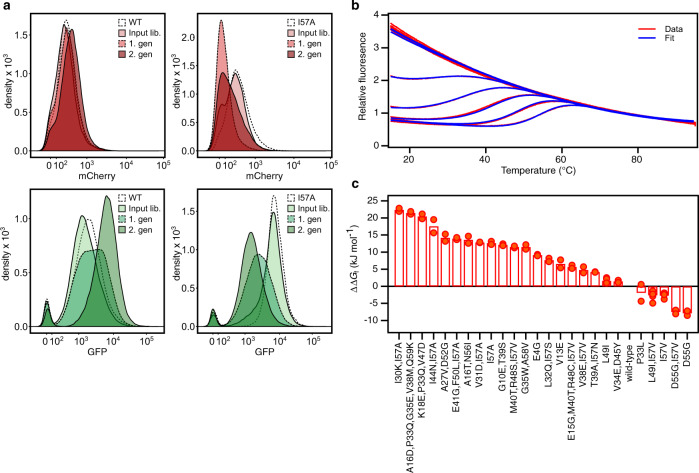
Fig. 1. Selection and stability of CI2 variants.
a FACS profiles of E. coli cultures expressing libraries of random mutations in wild-type CI2 (left column) and in CI2,I57A (right column). mCherry fluorescence and GPF fluorescence are shown in the upper and lower rows, respectively. Profiles for the background variants of CI2, the input mutant library and the two rounds of sorting are shown. b Thermal unfolding curves of CI2,I57A measured by fluorescence at 350 nm at 13 concentrations of GuHCl ranging from 0 to 5 M. The experimental data are shown in red and the fits to a model for two-state folding as blue lines. c Difference in the free energy for folding, ΔΔGf, relative to wild-type CI2 for 26 variants. The ΔGf for each variant was found by non-linear global fits of fluorescence unfolding data. For most variants two denaturant series were fitted (n = 2), except for L49I (n = 4), I57V (n = 3) and L49I/I57V (n = 6).

