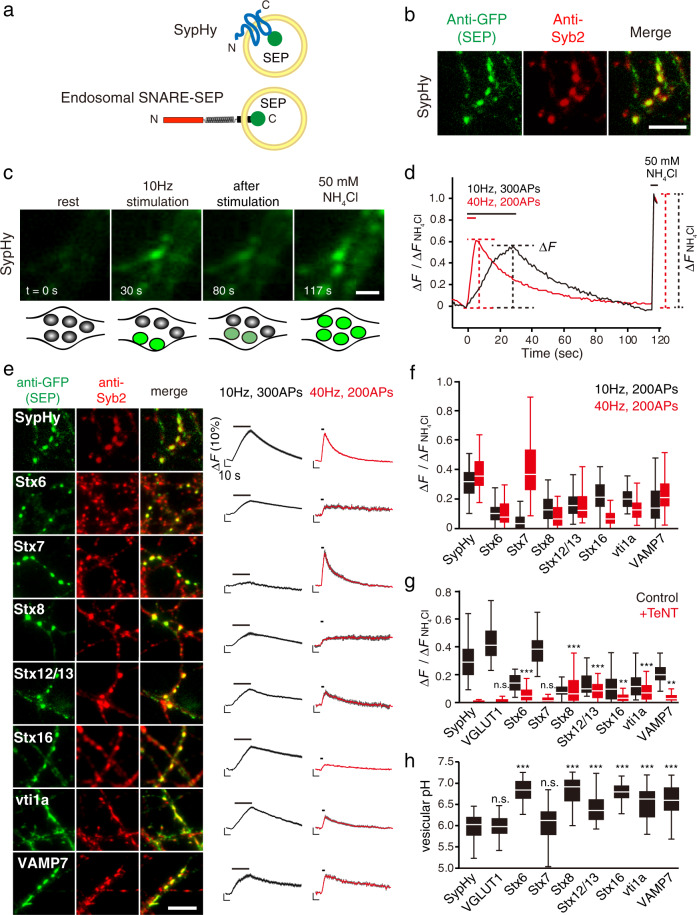
Fig. 1. Comprehensive monitoring of presynaptic endosomal SNARE-SEPs reveals their characteristic recycling behavior.
a Cartoon representation of SypHy (Synaptophysin-SEP) and an endosomal-SNARE-SEP. b-d Strategies for comprehensive characterization of presynaptic SNARE-SEPs. After SEP constructs were lentivirally transduced in cultured hippocampal neurons, distributions of SEP-fused proteins and their responses to repetitive electrical stimulation were analyzed by immunocytochemistry (b) and fluorescence live imaging (c, d). Representative results obtained for SypHy are shown. The SEP was visualized with anti-GFP antibody, whereas locations of presynaptic boutons were identified with anti-synaptobrevin 2 (Syb2) antibody. To estimate fractional responses of each SEP construct, 50 mM NH4Cl (pH7.4) was applied at the end of recordings, which revealed the total expression of SEP-fused proteins at individual boutons. Scale bars indicate 5 µm in (b) and 2 µm in (c). e Synaptic localization and stimulus-dependent recycling of endosomal SNARE-SEPs upon 10 Hz or 40 Hz stimulation. Left images are representative images of each SEP-fused protein, co-stained with anti-Syb2 antibody. Scale bar indicates 5 μm. Right traces show average fluorescence of individual SEP-fused proteins upon 10 Hz (300 APs; black) and 40 Hz (200 APs; red) stimulation. Fluorescence was normalized to those during NH4Cl application. Data are averages of 50−200 boutons. f A box-whisker plot showing the peak fluorescence of the respective SEP probes at 200APs of 10 Hz (black) and 40 Hz stimulation (red). The boxes, the white lines in the boxes, and the whiskers in this plot and hereafter indicate the first and third quartiles, the medians, and the minimum and maximum values, respectively. g A box-whisker plot showing the effect of TeNT pretreatment on recycling of SEP probes in comparison to SypHy at 40 Hz stimulation (200 APs) (see also Supplementary Fig. 2). Data were obtained from 35−100 boutons. P-values indicate n.s p > 0.05, ** p < 0.01, and *** p < 0.001 in comparison to SypHy after TeNT treatment (Student’s t-test). h A box-whisker plot showing luminal pHs of vesicle compartments carrying the respective SEP probes calculated from experiments in Supplementary Fig. 3. *** p < 0.001 indicates p-values in comparison to vesicular pH of SypHy (Student’s t-test).

