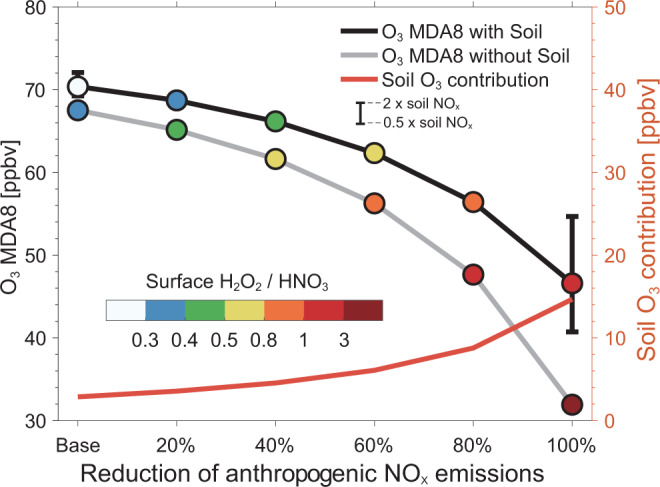
Fig. 3. The presence of soil NOx emissions suppresses the sensitivity of ozone to anthropogenic NOx emissions.

The GEOS-Chem simulated responses of MDA8 ozone in the NCP to the decline of anthropogenic NOx emissions by 20, 40, 60, 80, and 100% relative to July 2017 levels (left y-axis), in the presence (black line) and absence (gray line) of soil NOx emissions. The black bars represent the range of estimates with a factor of 2 uncertainty in soil NOx emissions. The colored circles represent the mean surface H2O2/HNO3 ratios for each emission scenario. The red line (right y-axis) shows the corresponding ozone contribution from soil NOx emissions as can also be estimated from the difference between the black and gray lines.
