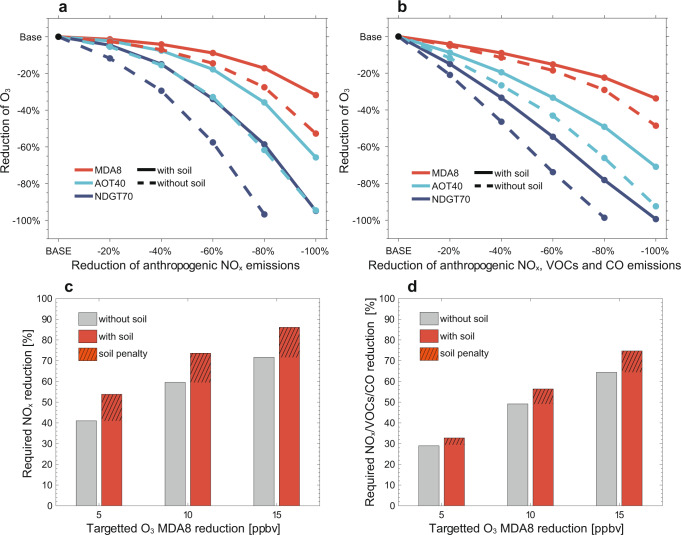
Fig. 4. The “soil NOx emission penalty” on anthropogenic ozone pollution regulation averaged in the 55 NCP cities.
Panels a and b show the responses of ozone metrics (MDA8, AOT40, and NDGT70, Methods) to the reductions of anthropogenic NOx emissions, and the joint reductions of anthropogenic NOx, VOCs, and CO emissions, respectively. Panels c and d show the required reduction of anthropogenic NOx emissions or joint reduction of anthropogenic NOx, VOCs, and CO emissions for different ozone control targets in the NCP cities, estimated from panels a and b by a logarithmic fitting (Supplementary Table 5), both in the presence (gray) and absence (red) of soil NOx emissions. The difference between the red and gray bars thus illustrates the soil NOx emission penalty, i.e., extra anthropogenic emission reduction imposed by the presence of high soil NOx emissions.

