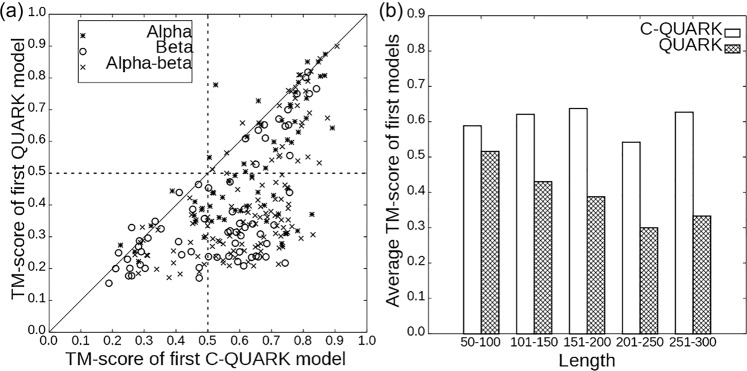
Fig. 2. Comparison of C-QUARK and QUARK models on 247 test proteins.
a TM-scores of the first models by C-QUARK versus those by QUARK for different protein classes, where the dotted-crosses represent the alpha proteins, the circles represent the beta proteins, and the crosses indicate the alpha-beta proteins. b Average TM-scores by C-QUARK and QUARK at different protein-length intervals, where the white bars represent the C-QUARK results and the gray bars correspond to the QUARK results.

