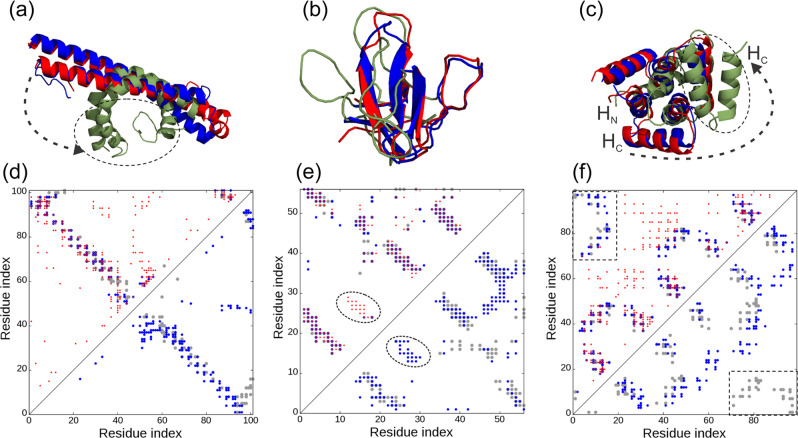
Fig. 4. Illustrative examples for C-QUARK and CNS structure prediction on the same contact-maps.
a–c Overlay of predicted models (blue: C-QUARK; green: CNS) with the native (red) for 3teqB [10.2210/pdb3TEQ/pdb], 1zuuA [10.2210/pdb1ZUU/pdb] and 4yy2A [10.2210/pdb4YY2/pdb], respectively. d–e Corresponding contact-maps for the native structure (gray circles), predicted contacts (red circles), contacts in the C-QUARK models (blue circles in the upper left triangles), and contacts in the CNS models (blue circles in the lower right triangle). In a, the dashed circle and arrow mark the unrealistic bending of the helices in the CNS model due to satisfying too many falsely predicted contacts. In e, the dashed circle highlights the falsely predicted beta-sheet that was filtered out by C-QUARK but not by CNS. In c, f, the dashed circle and arrow mark the incorrect move of the C-terminal helix (HC) away from the N-terminal helix (HC) due to absent contact predictions, while C-QUARK’s inherent potential captured the inter-helix interactions as highlighted in the rectangular region of the contact-map.

