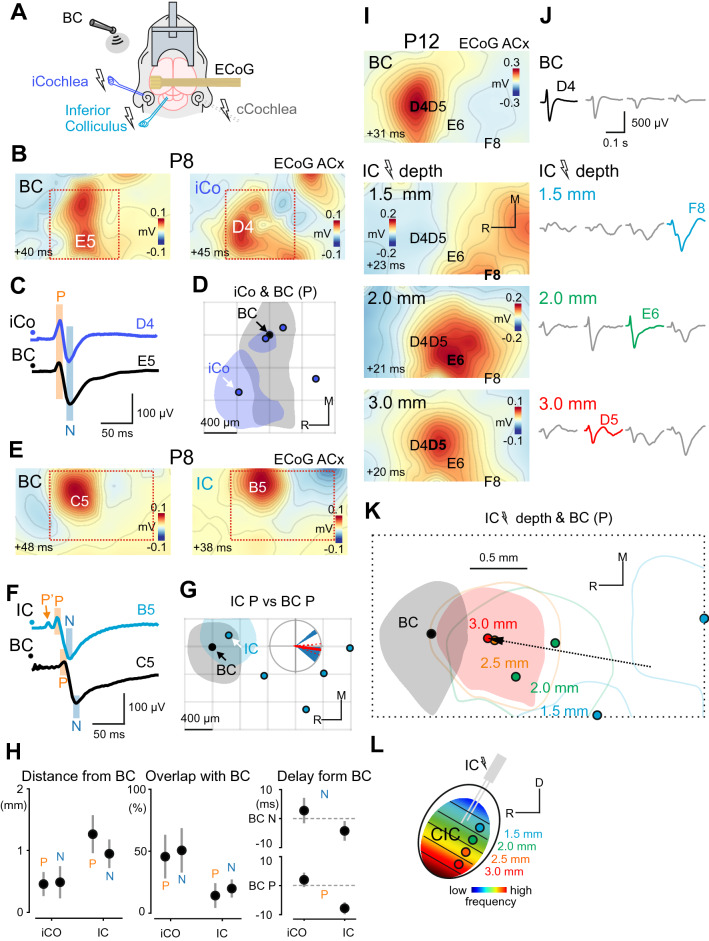
Figure 4.
BC-evoked responses co-localize with responses to ipsilateral cochlea (iCO) and inferior colliculus (IC) stimulation. (A) Experimental setup: μECoG arrays placed over the auditory cortex are used to record responses evoked by bone-conducted (BC) stimuli, and by electrical stimulation (50 µs, 60 V, 0.1 Hz) of the iCo and the IC. (B) Spatial maps of the P component of BC and iCo- evoked responses in a P8 animal (different to Fig. 3B–D animal). The onset of the 2 ms time window in which the signal was averaged is shown in the lower-left corner. (C) Corresponding ECoG traces on the channels with maximal amplitude for each map in (B). (D) Positions of iCo-evoked responses (blue dots) relative to BC responses (black dot) for P peaks. Half-width areas are shown for the animal on (B) and (C) (correspondent peak is indicated by the white arrow). Pooled data from 4 P8–16 animals. (E–G) Responses evoked by BC and IC stimuli in a P8 animal. The layout is similar to (B–D). Pooled data from 5 P8-15 animals. (H) Left, latencies of iCo and IC-evoked responses (P and N peaks) relative to BC-evoked responses. Middle, the distances between the peaks of iCo and IC-evoked responses and the peaks of BC-evoked responses. Right, the overlap between BC-activated and iCo or IC-activated half-width areas normalized to the size of the BC half-width area. (I) Spatial maps of BC (top) and IC-evoked responses at different depths of stimulation (1.5–3 mm). (J) ECoG traces on the channels with maximal amplitude for each map in (I). (K) Positions of IC-evoked responses at different depths of stimulation (indicated by color dots) relative to BC-evoked responses (black dot) for P peaks are shown for the animal on (I) and (J). Note that the half-width area of the BC-evoked response (black fill) overlaps with the half-width area of the IC-evoked response at 3.0 mm (red fill), whereas the tonotopic gradient (black arrow) of IC-evoked responses is directed towards the position of the BC-evoked response. (L) Diagram illustrating the distribution of tonotopic layers across the depth of the IC. CIC Central nucleus of the inferior colliculus, R Rostral, D Dorsal.

