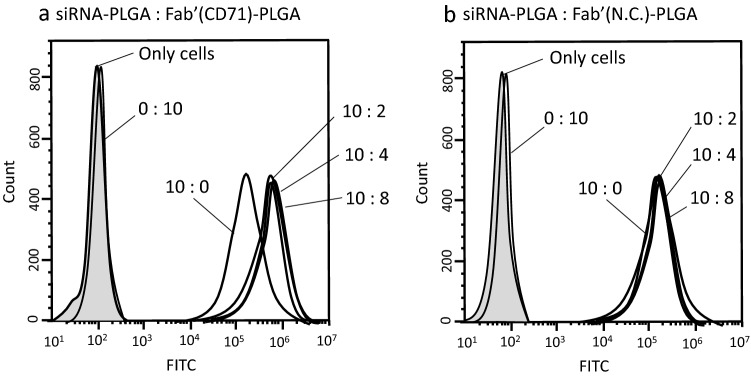
Figure 3.
Flow cytometric measurement of the fluorescence intensity of CEMx174 cells that were transfected Alexa488-siRNA using various mixing weight ratios of siRNA–PLGA and Fabʹ–PLGA mixed micelles. The mixing volume ratio at the side of peak in the figure is shown as (Alexa488-siRNA)–PLGA:Fabʹ(anti CD71 Ab)–PLGA (a) and (Alexa488-siRNA)–PLGA:Fabʹ(normal mouse IgG as a negative control)–PLGA (b), respectively. The figures were created using NovoCyte Software NovoExpress version. 1.2.4.

