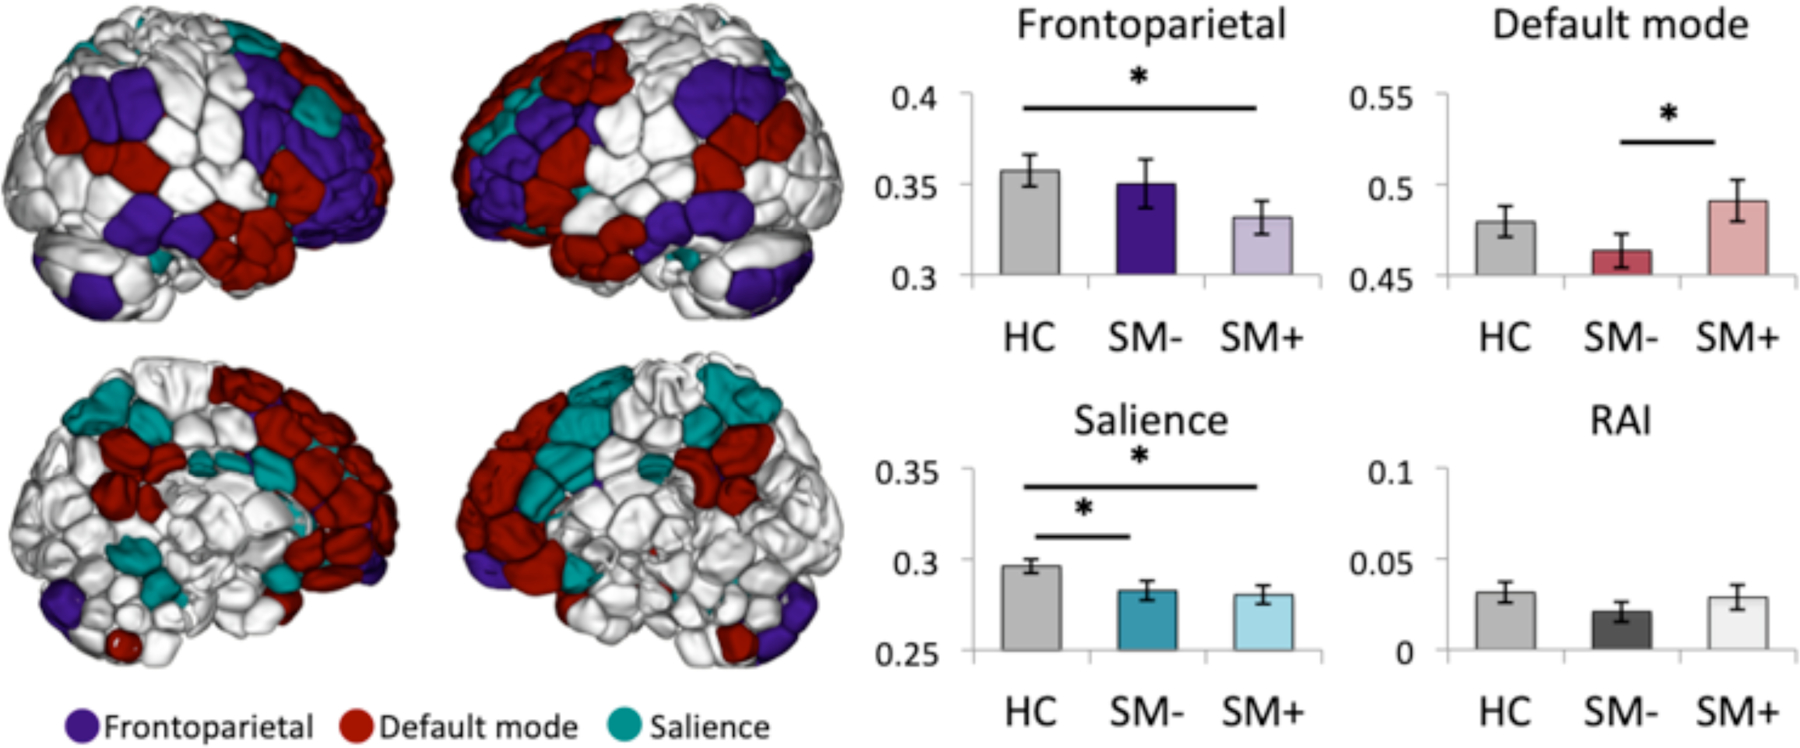
Figure 1 – Canonical network and resource allocation index comparisons of non-smokers versus smokers during deprived and satiated states.

Left: Lateral (top) and medial (bottom) maps showing node definitions for frontoparietal, default mode and salience networks. Nodes were defined using the Shen-268 parcellation and canonical networks were defined based on prior work(37, 38, 69). Right: Mean±standard error canonical network and resource allocation index (RAI) strengths are plotted for healthy controls (HC), deprived smokers (SM-) and satiated smokers (SM+).
