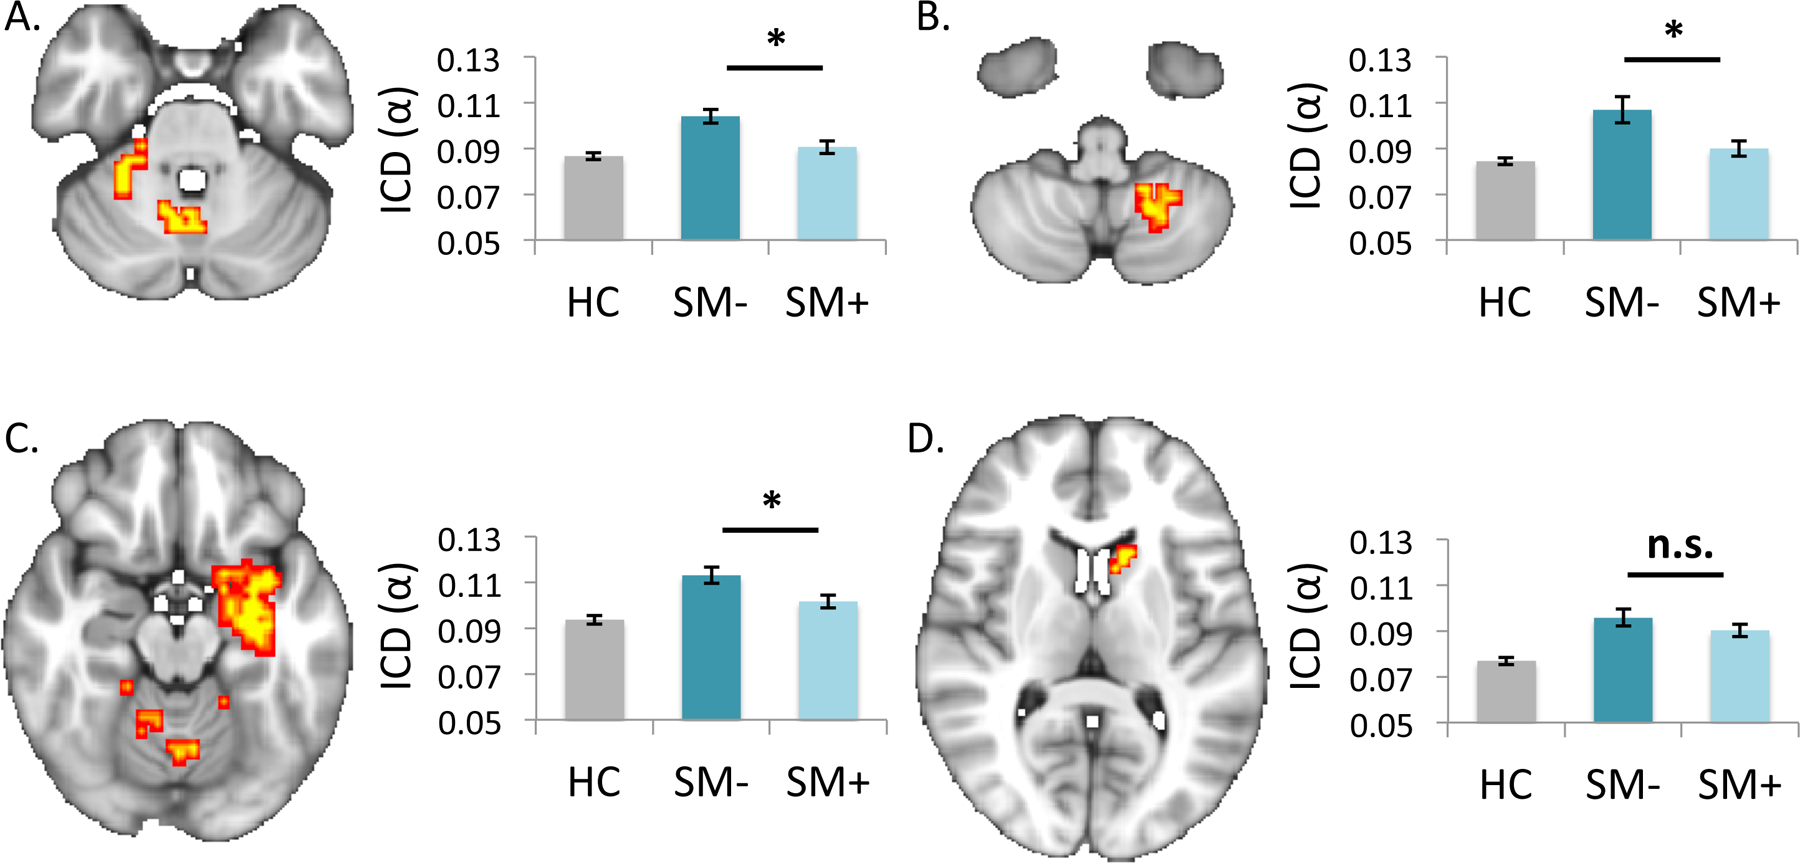
Figure 2 – Whole-brain intrinsic connectivity comparisons of non-smokers versus smokers during deprived and satiated states.

Statistical maps show findings from whole-brain intrinsic connectivity distribution (ICD) comparisons of healthy controls versus deprived smokers (pTFCE<.01). Corresponding cluster values for healthy controls (HC), deprived smokers (SM-) and satiated smokers (SM+) are plotted for (a) right and (b) left cerebellar clusters and for (c) right hippocampal and (d) left striatal clusters. Post-hoc analyses indicated significant decreases in connectivity with cerebellar and hippocampal regions following smoking reinstatement. Images are shown in radiological convention (left=right). *p<.05; n.s.=not significant (p>.05).
