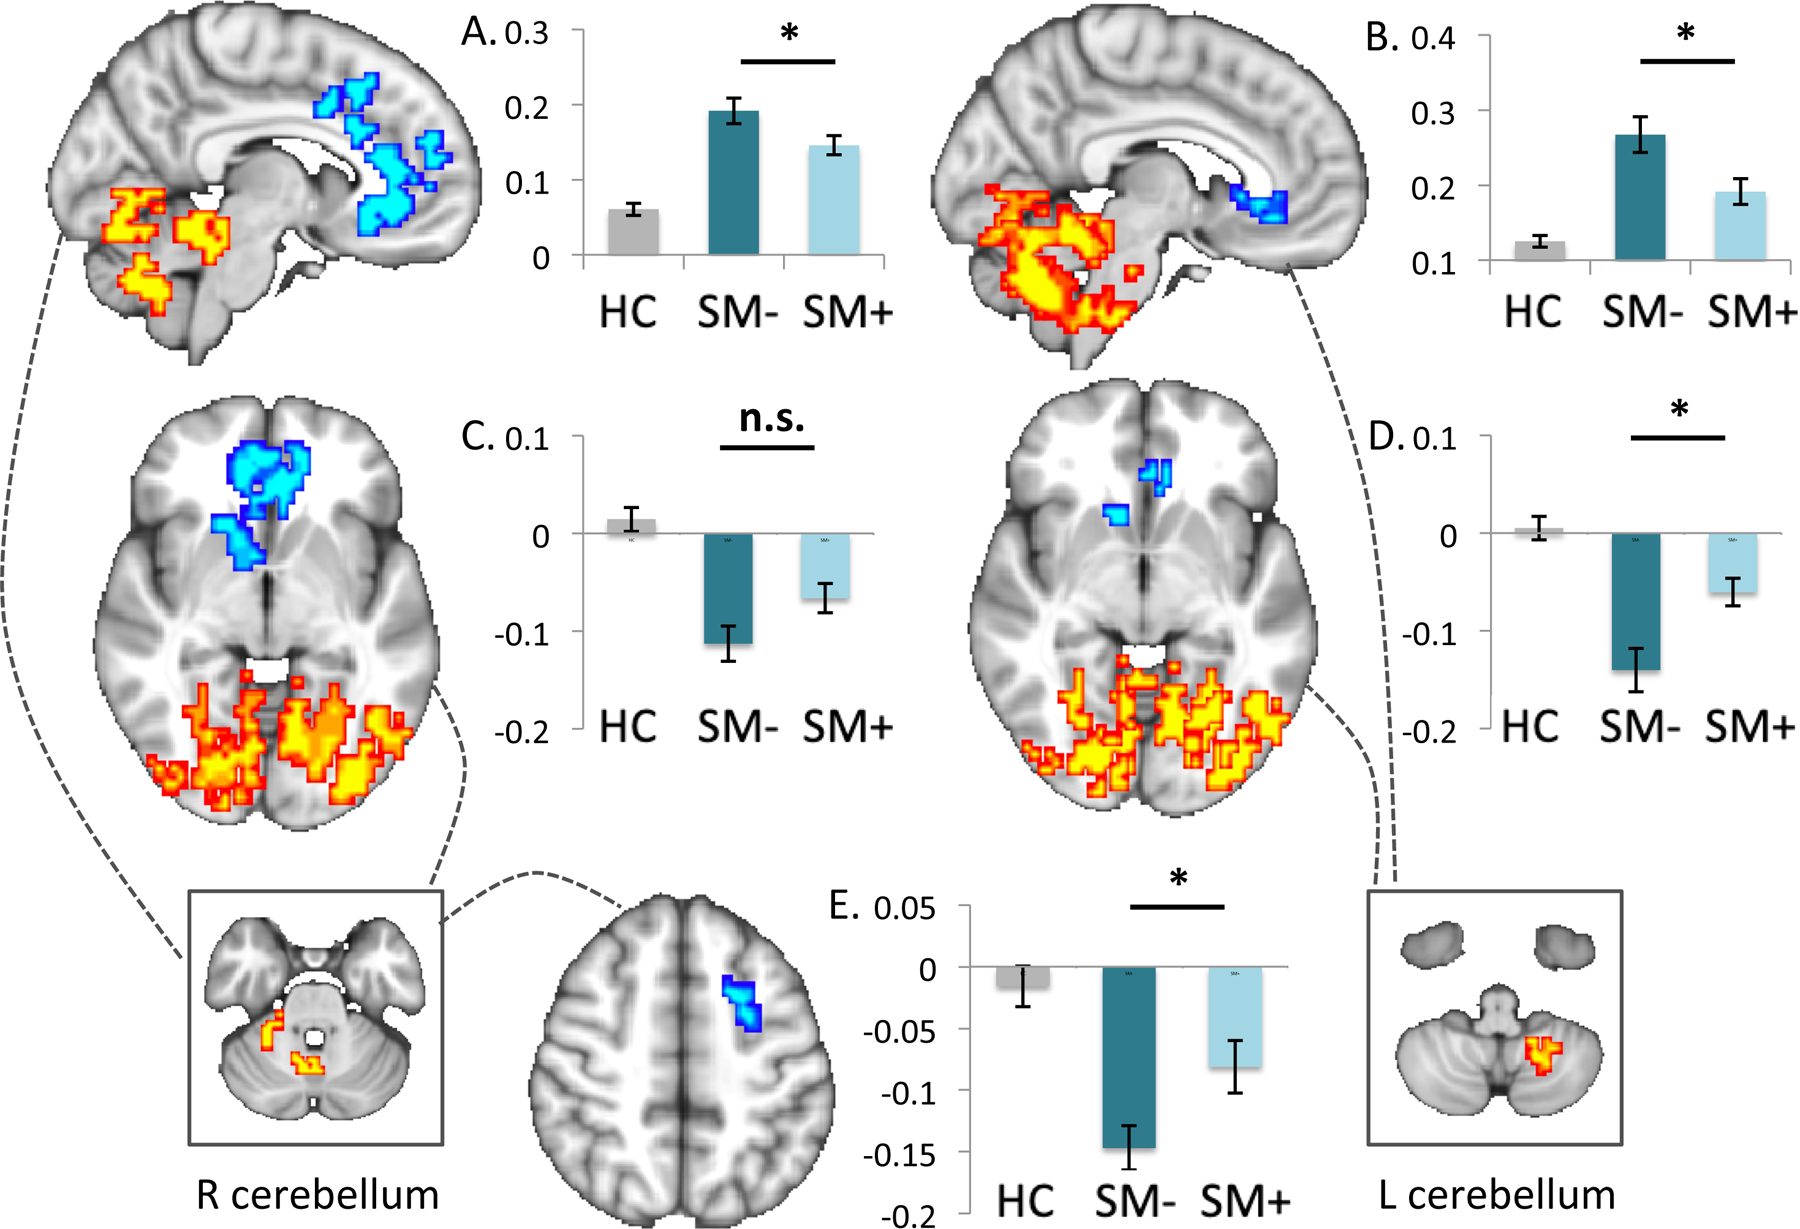
Figure 3 – Seed-based connectivity comparisons of non-smokers versus smokers during deprived and satiated states.

Findings from seed-based connectivity analyses (pTFCE<.05) using clusters identified in whole-brain intrinsic connectivity distribution (ICD) comparisons of deprived smokers versus healthy controls are shown for the right and left cerebellar seeds (boxes at bottom) with dotted lines indicating resultant whole-brain maps. Cluster values for healthy controls, deprived and satiated smokers are plotted for cerebellar clusters (top, a, b), corticostriatal clusters (middle, c, d) and for the medial PFC (bottom, e). The y-axis indicates α. Images are shown in radiological convention (left=right). *p<.05; n.s.=not significant (p>.05).
