

Abstract
Biomolecular condensates often consist of intrinsically disordered protein and RNA molecules, which together promote the formation of membraneless organelles in cells. The nucleation, condensation, and maturation of condensates is a critical yet poorly understood process. Here, we present single-molecule and accompanying ensemble methods to quantify these processes more comprehensively. In particular, we focus on how to properly design and execute a single-molecule nucleation assay, in which we detect signals arising from individual units of fluorescently labeled RNA-binding proteins associating with an RNA substrate. The analysis of this data allows one to determine the kinetics involved with each step of nucleation. Complemented with meso-scale techniques that measure the biophysical properties of ribonucleoprotein condensates, the methods described herein are powerful tools that can be adopted for studying any protein-RNA interactions that undergo phase separation.
Keywords: phase separation, condensates, nucleation, optical trap, diffusion, single-molecule
1. Introduction
The functional compartmentalization of proteins, nucleic acids, and other molecules is one of the most fundamental roles of cells. By controlling the contents of distinct organelles, cells can efficiently perform the various tasks needed for survival. However, recent studies have highlighted the importance of liquid-liquid phase separation (LLPS) as a mechanism underlying transient and highly reversible membraneless granule formation, which occur both within the cytoplasm and nucleus [1]. These granules are necessary for diverse functions such as the sequestration of RNAs during stress and organizing the DNA damage response [2, 3]. Disordered RNA-binding proteins (RBPs) along with multivalent RNA molecules can together rapidly undergo LLPS into condensates [4–6]. Aberrant RNP condensates with perturbed biophysical properties have been implicated in cancer and neurodegeneration [7, 8]. Despite the biologically important roles of various cellular condensates, the molecular understanding of how protein and RNA interact to initiate the nucleation that leads to condensation is missing, in part due to the lack of precise methods to measure such key parameters.
Single-molecule methods are uniquely suited to probe the nucleation process despite the complexity of disordered proteins and their RNP complexes. Single-molecule FRET measurement on RNA-protein interaction has shown that dynamic or static interactions with RNA underly the formation of liquid-like or gel-like condensates [5, 9–11]. The kinetics of RNA binding and protein-protein interactions can be extracted for individual RNPs, allowing a more complete understanding of the type of RNA-protein interaction that favors LLPS [12]. The concentration of RNA and the exchange rate of RNA in and out of RNP condensates also varies as a function of RNA shape [11], indicating the importance of RNA in controlling the physical properties of condensates.
Here, we describe tools to study the formation RNP complexes and properties of resulting condensates. We will focus on (1) designing single-molecule experiments to study the nucleation steps toward LLPS and (2) improving single-molecule and ensemble methods to probe the physical properties of RNP condensates. Moreover, we will review several strategies to maximize the quality and quantity of the results that can be extracted from these data-rich methods.
2. Protein and RNA Preparation
2.1. Protein purification and labeling
Robust, clean, and reproducible purification that produces soluble (not aggregated) product of disordered proteins is especially critical for single-molecule applications. Bacterial or insect cells can both be used, though each system has limitations: bacterial expression systems lack the post-translational modifications that may modulate LLPS properties [13], whereas insect expression systems are slower to grow and more laborious to culture in the lab. For both systems, it is advisable to include a solubility tag – such as maltose binding protein or glutathione S-transferase – at the N- or C-terminus of the protein (Figure 1A). Many disordered proteins tend to be insoluble without such a tag [14]. By including a protease recognition motif between the protein coding sequence and the solubility tag, one can also control when LLPS reactions begin (Figure 1A). Some disordered proteins may need to be purified in denaturing conditions to prevent premature aggregation. We favor purification methods with fewer processing steps – such as nickel affinity chromatography – that reduces protein aggregation (Figure 1A).
Figure 1: Design of RBP and RNA constructs.
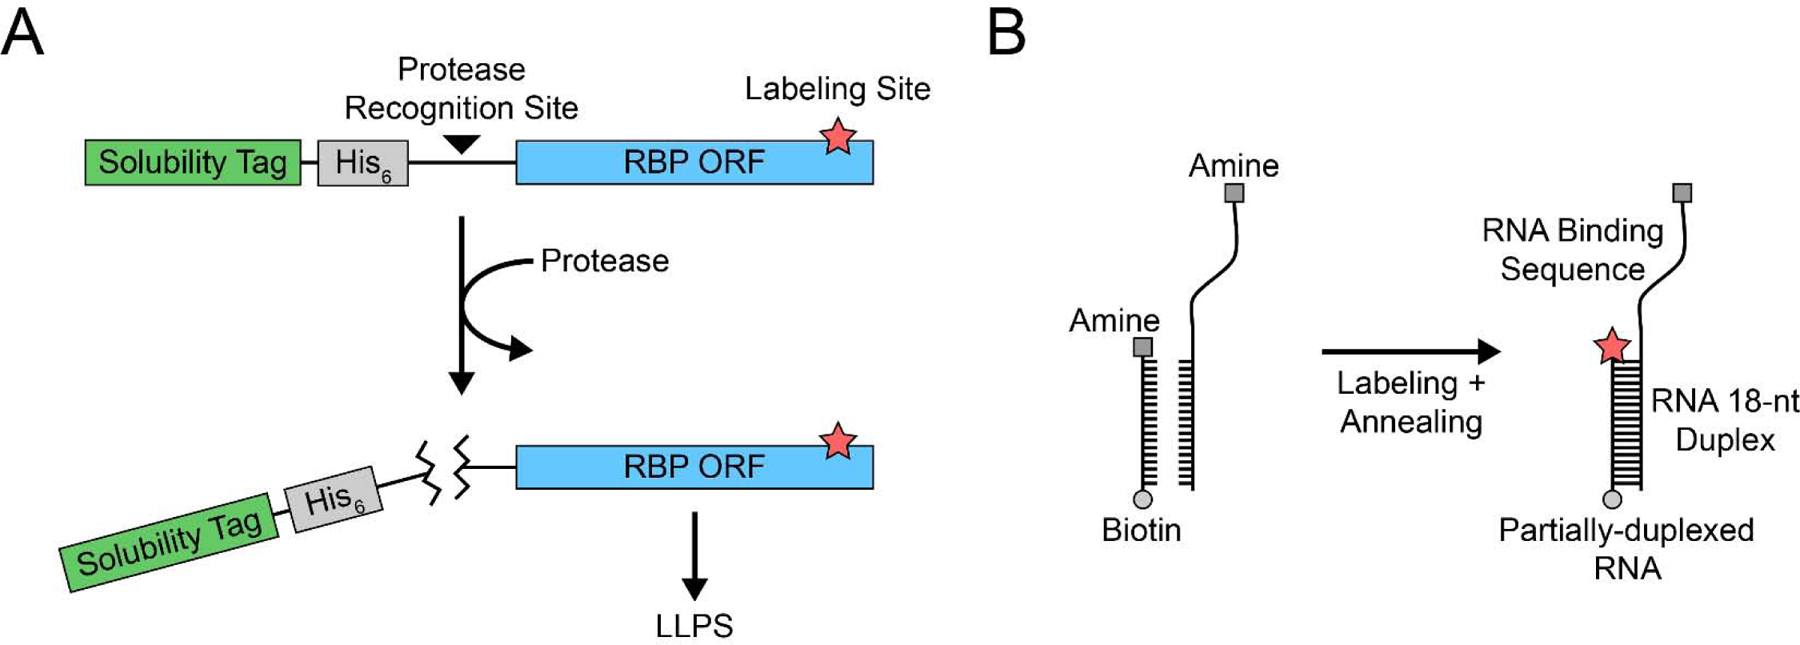
(A) RBP expression plasmids should ideally contain a solubility tag (green) and simple purification tag (gray) that can be cleaved off with a site-specific protease. The protein open reading frame (ORF) can be modified to accommodate a site-specific label, e.g. maleimide labeling. (B) Two RNA strands with complementary 18-nt duplex sequences can be designed with amine groups for NHS ester labeling. One strand should have the RNA binding sequence for the RBP, and the other should have the biotin for single-molecule slide conjugation.
It is important to consider how the protein and RNA will be visualized for in vitro reactions. When possible, one can take an advantage of labeling RNA with fluorophores which minimizes adverse effects that may arise from protein labeling (see 2.2. RNA design and labeling below). For many experiments, labeled RNA can report on unlabeled protein binding and activity. Despite the potentially disruptive nature of fluorophores, labeled proteins can provide important insights as long as the protein activity is preserved. Therefore, site specific mutations for labeling should also be considered, such as cysteine for maleimide dye conjugation (Figure 1A). Any protein variants with altered primary sequences should be compared to the wild-type protein because even seemingly innocuous amino acid substitutions can significantly disrupt normal LLPS [5]. Moreover, the use of fluorescent protein tags (e.g. GFP) is not recommended because they can also alter the LLPS properties of the purified protein [15]. Excess dye must be removed from the protein to limit background fluorescence during single-molecule imaging. Additional centrifugation or filtering steps may be performed to remove aggregates.
2.2. RNA design and labeling
Disordered RBPs often bind RNA through a combination of specific RNA binding domains and nonspecific RGG-rich domains [6]. Therefore, many RNA sequences may be suitable for promoting LLPS, including structured and unstructured RNAs [5, 16]. Despite the importance of using a biologically relevant structured and repeat RNAs [17], homopolymers such as poly-uracil are unstructured and therefore simpler to understand for initial experiments. RNAs with high guanine content should be avoided due to the formation of G-quadruplexes, which can lead to aggregation [18].
Once a suitable RNA binding sequence has been selected, constructs for single-molecule and ensemble experiments can be designed. In TIRF experiments, partially duplexed RNAs can be synthesized in which one strand has a biotin conjugated at one end and an amine modification at the other end for NHS-ester labeling, whereas the other strand has the complementary sequence for annealing to the first strand followed by a putative RNA binding sequence and an amine modification for NHS-ester labeling to make a FRET pair (Figure 1B). The annealed FRET construct is tethered to single molecule surface via a biotin-NeutrAvidin linkage. The same substrate without biotin can be used for ensemble experiments. The protocol for fluorescent labeling of RNA is well-documented, and excess dye can be removed through ethanol precipitation. The labeling efficiency can be determined by measuring the optical density of RNA and dye at the appropriate wavelength [19].
3. Single-molecule nucleation
The single molecule nucleation assay entails imaging fluorescent RBP binding on an RNA scaffold, allowing one to directly observe the RNA-dependent association and subsequent oligomerization of RBPs in real time. In these experiments, one or two differently labeled proteins can be flowed onto a single-molecule surface on which unlabeled or singly-labeled RNA is tethered (Figure 2). A fluorescence increase at RNA foci can be interpreted as a specific binding event, and further stepwise increases in fluorescence represent successive association or oligomerization. A decrease in signal can be due to photobleaching or unbinding events, depending on the stability of the protein-RNA complex that can be measured through FRET or other experiments. The number, duration, intensity, and colocalization of binding events can be extracted from single-molecule traces.
Figure 2: Single-molecule nucleation setup.
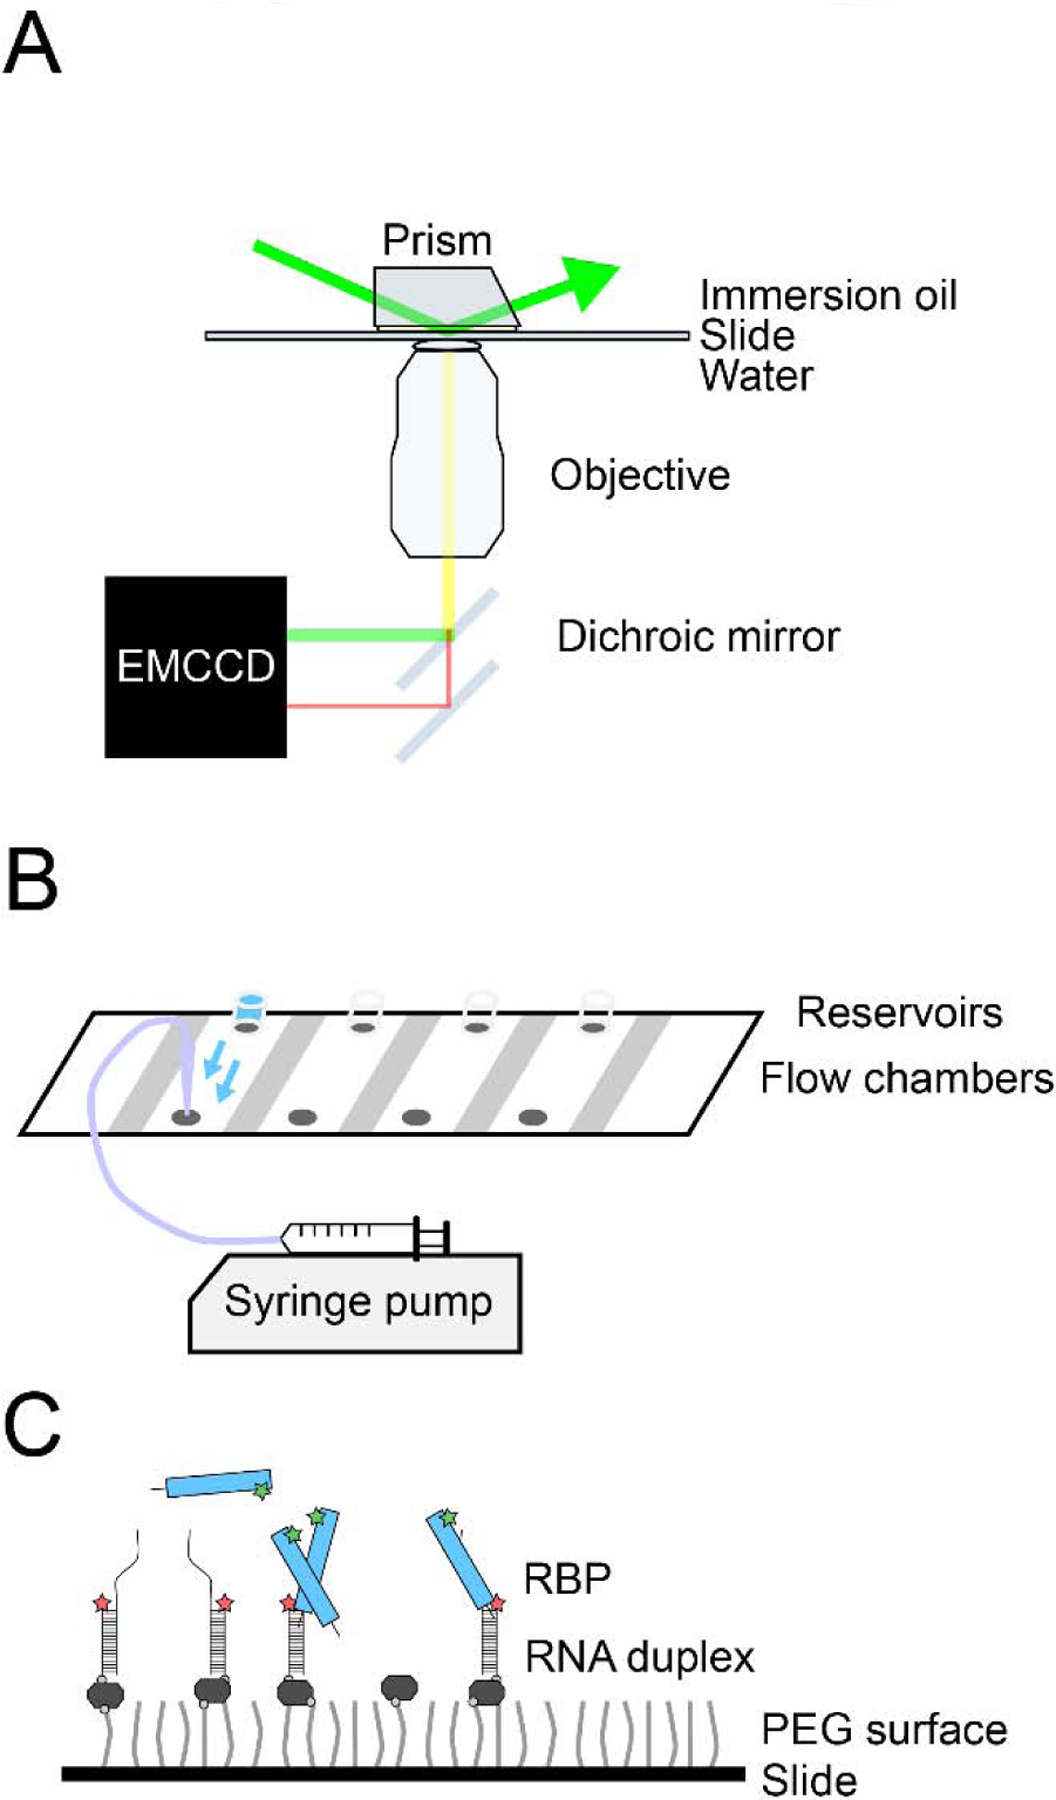
(A) A simple overview of the TIRF microscope setup. (B) A schematic of the quartz slide with reservoirs attached to the drilled holes to facilitate automated flow of the protein solution via a syringe pump. (C) Schematic of the single-molecule surface with singly-labeled RNA partial duplexes and singly-labeled RBPs.
3.1. Nucleation experiment setup and design
Single molecule binding events can be acquired using a prism-type TIRF microscope (Figure 2A). The power of the TIRF microscope comes from the selective illumination of a thin z-plane (~100 nm) of the sample in a quartz slide, which decreases background and allows single molecules to be visualized [20]. We generally use a single EMCCD camera with split (dichroic) fluorescence acquisition for the Cy3 and Cy5 channels (Figure 2A). A typical single-molecule experiment on a TIRF microscope yields ~300–500 molecules per field-of-view (25 μm × 75 μm). For multicolor experiments, an automated shutter controls sequential illumination of two or more fluorescent channels. Finally, a motorized pump delivers the reagent(s) to the flow chamber in a time-controlled manner. Previous reports have described in detail how to build a prism-type TIRF microscope and a flow set up [21, 22].
The single-molecule surface is prepared on a quartz slide-coverslip, both of which are passivated with PEG mixed with 1% biotinylated PEG [21, 23]. Flow chambers are constructed by drilling pairs of holes into the quartz slide and demarcating the chambers with thin strips of double-sided tape (Figure 2B). A slide-coverslip sandwich seals the flow chamber. The slide is treated with a sequence of different reagents to tether RNA and capture the real-time movies during the protein flow: (1) NeutrAvidin (~1% (w/v)) binds to the biotin-PEG surface, providing binding sites for the RNA, (2) partially-duplexed RNA (~50–100 pM) binds to the NeutrAvidin surface, and (3) the flow chamber is filled with an imaging buffer, which contains an oxygen-scavenging system to limit photobleaching (Figure 2C). The oxygen-scavenging system may be omitted if photobleaching events are the desired readout (see below).
For TIRF imaging, it is advised to use one channel for optimizing the labeled RNA concentration to achieve single-molecule density on the surface and to check for the protein binding. The fluorophore with the shorter emission wavelength should be used to label the protein because the fluorophores with higher molecular weight and bulkier chemistry such as Cy7 may increase aggregation of disordered proteins [24]. Future experiments can alter the labeling scheme to answer different experimental questions, e.g. dual-labeled proteins can report on the protein conformation with or without RNA binding.
3.2. Nucleation data acquisition
Following preparation of the single-molecule slide and TIRF microscope, protein can be flowed onto the surface to observe binding. The chamber should be pre-equilibrated with the same buffer in which the protein will be flowed (salt and buffer adjusted imaging buffer) to detect the signal change due to the protein binding not due to the buffer change. The solubility tag can be cleaved immediately preceding the experiment by adding sites-pecific proteases such as TEV. The concentration of fluorescently labeled protein should be limited to 25 nM since higher concentrations will saturate the TIRF illumination field and prevent detection of single molecules. If higher concentrations are required, labeled and unlabeled protein can be mixed. Although this will alter quantification of the nucleation experiment (see below), appropriate controls can still make these experiments informative.
Illumination of the slide can be altered to suit the experiment. For most binding events, 100 ms exposure time is sufficient to observe fluorescence. A quick 1 s (10 frames) excitation burst in the RNA channel at the beginning and end of the experiment can be used to identify the location of RNA molecules. The rest of the detection can be performed in the protein’s fluorescent channel. Experiments with multiple colors of fluorescent molecules can be acquired with alternating excitation (ALEX) coupled with an automated shutter to observe long-lived binding events [25]. For stable binding, 1 s (10 frames) in each channel is sufficient to capture events reliably. Transient binding events can be better detected using continuous one-color excitation since they may be missed during ALEX imaging regimes.
The fluorescent protein solution can be introduced to the surface using a motorized syringe pump attached to the single-molecule slide. The pump draws the solution through the slide from a buffer reservoir attached to the drilled hole opposite of the pump attachment. It is usually advisable to have a few seconds of lead time before flowing the protein to measure the background fluorescence, which can be subtracted from the signals.
3.3. Analysis of nucleation experiments
The analysis pipeline for nucleation data includes the following three steps: (1) identification and mapping of single-molecule spots in the movie, (2) de-interleaving of ALEX excitation, and (3) plotting and analysis of single-molecule traces. The first two steps have been extensively covered [21]. Therefore, this section will focus on the third step of how to interpret nucleation traces.
Disordered RBPs tend to have promiscuous interactions with RNA, which necessitates identification of the dominant behaviors for the nucleation prior to formal analysis; some RBPs may bind RNA transiently, whereas other RBPs may exhibit extremely stable long-lived RNA binding. Differentiating between long-lived and transient binding events can be informative about the nature of the RNP condensate, especially because RNAs have been shown to readily transit into and out of granules in vivo and condensates in vitro [5, 26]. Long-lived binding events can be better detected with FRET-labeled RNA since the protein-conjugated fluorophores are more prone to photobleaching [5].
There are four parameters that can be extracted from the RBP nucleation events: the total number of binding events per trace, the intensity of each binding event, the dwell time of the bound state, and the colocalization between the fluorescent channels for ALEX experiments (Figure 3). If the protein remains bound to the RNA, the cumulative number of binding events reveals the oligomerization status in the given concentration of protein. Oligomerization is a function of concentration and LLPS-favorable conditions can promote rapid multimerization on a single RNA. If proteins oligomerize in solution, the binding to the RNA can be identified by a higher intensity binding event which produces multiple photobleaching steps. Assuming near 100% labeling efficiency, the intensity of the binding event is directly correlated to the number of proteins binding to the RNA, although there is some molecule-to-molecule variability in fluorophore intensity. A standard curve can be generated to directly correlate the number of bound proteins to the intensity if the TIRF illumination is even across the field of view. Binding events can be binned into long-lived (>1 s) or transient (<1 s) events as mentioned above, and the length of the bound state can be analyzed by collecting dwell times of binding events. Finally, if multiple fluorophores are flowed onto the surface, all of the aforementioned quantification can be performed for both fluorophores alongside a simple binary check whether the two fluorophores overlap or not. Another important consideration is that the data should be filtered to only include proteins bound to RNA which can be identified by illuminating RNA channel prior to protein imaging as discussed above. The analysis algorithm should be written to capture binding events all throughout the acquisition rather than biasing toward the beginning or end of the movie.
Figure 3: Single-molecule nucleation traces displaying different quantifiable parameters.
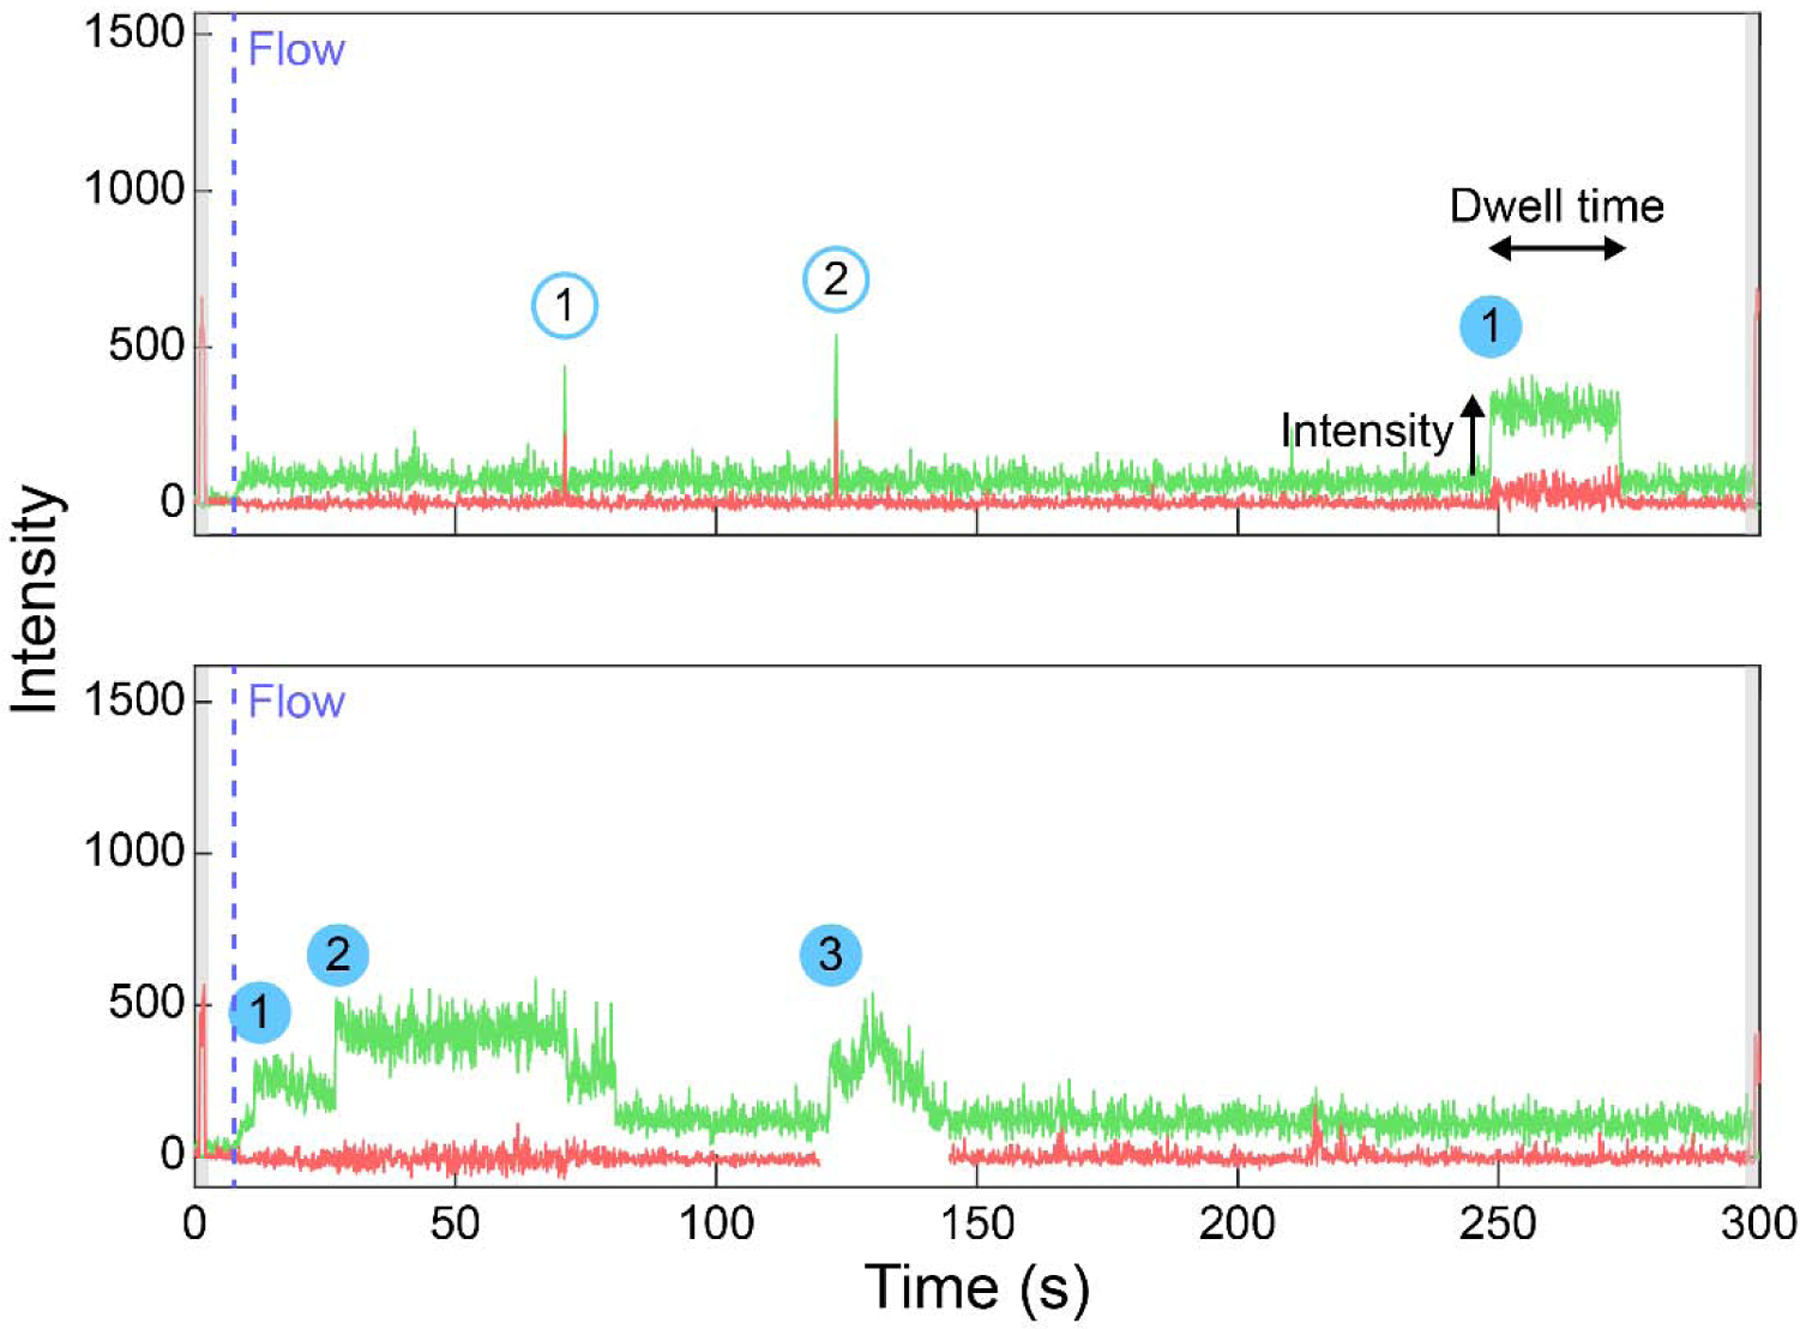
Single-molecule traces (green = Cy3, red = Cy5) of 5 nM Cy3-FUS protein added to a Cy5-labeled poly-U partially duplexed RNA. The shaded gray region indicates the red channel excitation at the beginning and end of video acquisition, the dashed blue line marks the beginning of flow, the shaded blue circles denote cumulative long-lived binding events, the outlined blue circles are cumulative transient binding events. Dwell time and intensity parameters are also labeled on one of the binding events.
We also note that although single-molecule nucleation assays provide a snapshot of the formation of RNP complexes, the low concentrations that are typically used for these experiments may impact the interpretation of the findings. Concentrations below 25 nM may not cross the threshold at which RBPs achieve the nucleation regime [1], so these binding events may instead reflect simple oligomeric binding to RNA. To gain further insight into the behavior of condensates, small concentrations of labeled protein may be used together with high concentrations of unlabeled protein.
4. Optical trapping of RNP condensates
The physical properties of the condensates that form after the nucleation step is a critical aspect of RNP granules i.e. loss of liquid-like state is linked to pathophysiology of neurodegeneration-linked proteins [7]. Altered nucleation can give rise to condensates with dynamically arrested, gel-like, or solid-like properties, all of which have highly reduced fusion rate compared to liquid-like condensates [12]. Such transitions can be modulated by interactions with RNAs and as a function of condensate maturation time. The fusion properties of RNP condensates can be directly measured by using a dual optical trap [27]. In these experiments, condensates are formed in solution and flowed through a microfluidic chamber; individual condensates are then captured by each of the trapping lasers, moved to a condensate-free buffer, and brought in close proximity by moving one of the traps. The relaxation of the fused droplets into one spherical droplet – or the failure of the droplets to fuse – can be determined from fusion videos and quantified. Although this experiment is low-throughput and laborious, it is one of the most effective ways to test condensate fusion parameters in a controlled manner.
4.1. Optical trap setup and experimental design
Optical trap instruments can be custom-built or purchased [28]. We use a Lumicks C-Trap instrument, which has an integrated fluorescence confocal microscopy and dual- or quad-trap capabilities. The C-Trap has a built-in microfluidic chamber that is controlled by an automatic pressure gauge. For a simple fusion measurement, only two channels are needed: one for flowing condensates and another for flowing a condensate-free buffer in which the fusions are performed.
The condensate reaction is prepared by combining protein and RNA in an LLPS-forming condition. The formation of LLPS can be easily visualized by conventional wide-field or confocal microscopy under brightfield illumination. Fluorescence is not needed for droplet fusion, but it is useful for measuring the rate of content mixing between two differently labeled droplets, which may be different from the fusion kinetics. We use a low concentration of labeled RNA or protein (e.g. 10 nM) to visualize the condensates. As stated above, cleavage of solubility tag can initiate the condensation. The C-Trap can be passivated (and cleaned) according to the manufacturer’s instructions.
4.2. Acquisition and analysis of fusion videos
Use of the C-Trap allows for a precise control over fusion events, particularly in selecting similarly-sized droplets to fuse. Droplets are generally spherical in solution to minimize the free energy of the dense phase [1]. When two droplets fuse, they again relax into a spherical shape, with the aspect ratio (AR) of the fusing droplets following an exponential decay from approximately 2 to 1 as a function of time [9]. Droplet fusion events are recorded via the brightfield channel and analyzed using a custom MATLAB script.
Before analysis, each fusion video must first be converted from a series of grayscale images to binary “masks” that identify the boundaries of the droplets. Each frame is masked using intensity thresholding followed by several binary morphological operations. The masked video is manually checked for accuracy. Then, for each frame, the two fusing droplets are modeled as a single ellipse (Figure 4A). The AR is calculated as the ratio of the major axis length to the minor axis length of the ellipse [29]. It is important that the fusing droplets have similar diameters so that they can be accurately modeled as an ellipse as they fuse.
Figure 4: Analysis of condensate fusion to obtain inverse capillary velocity.
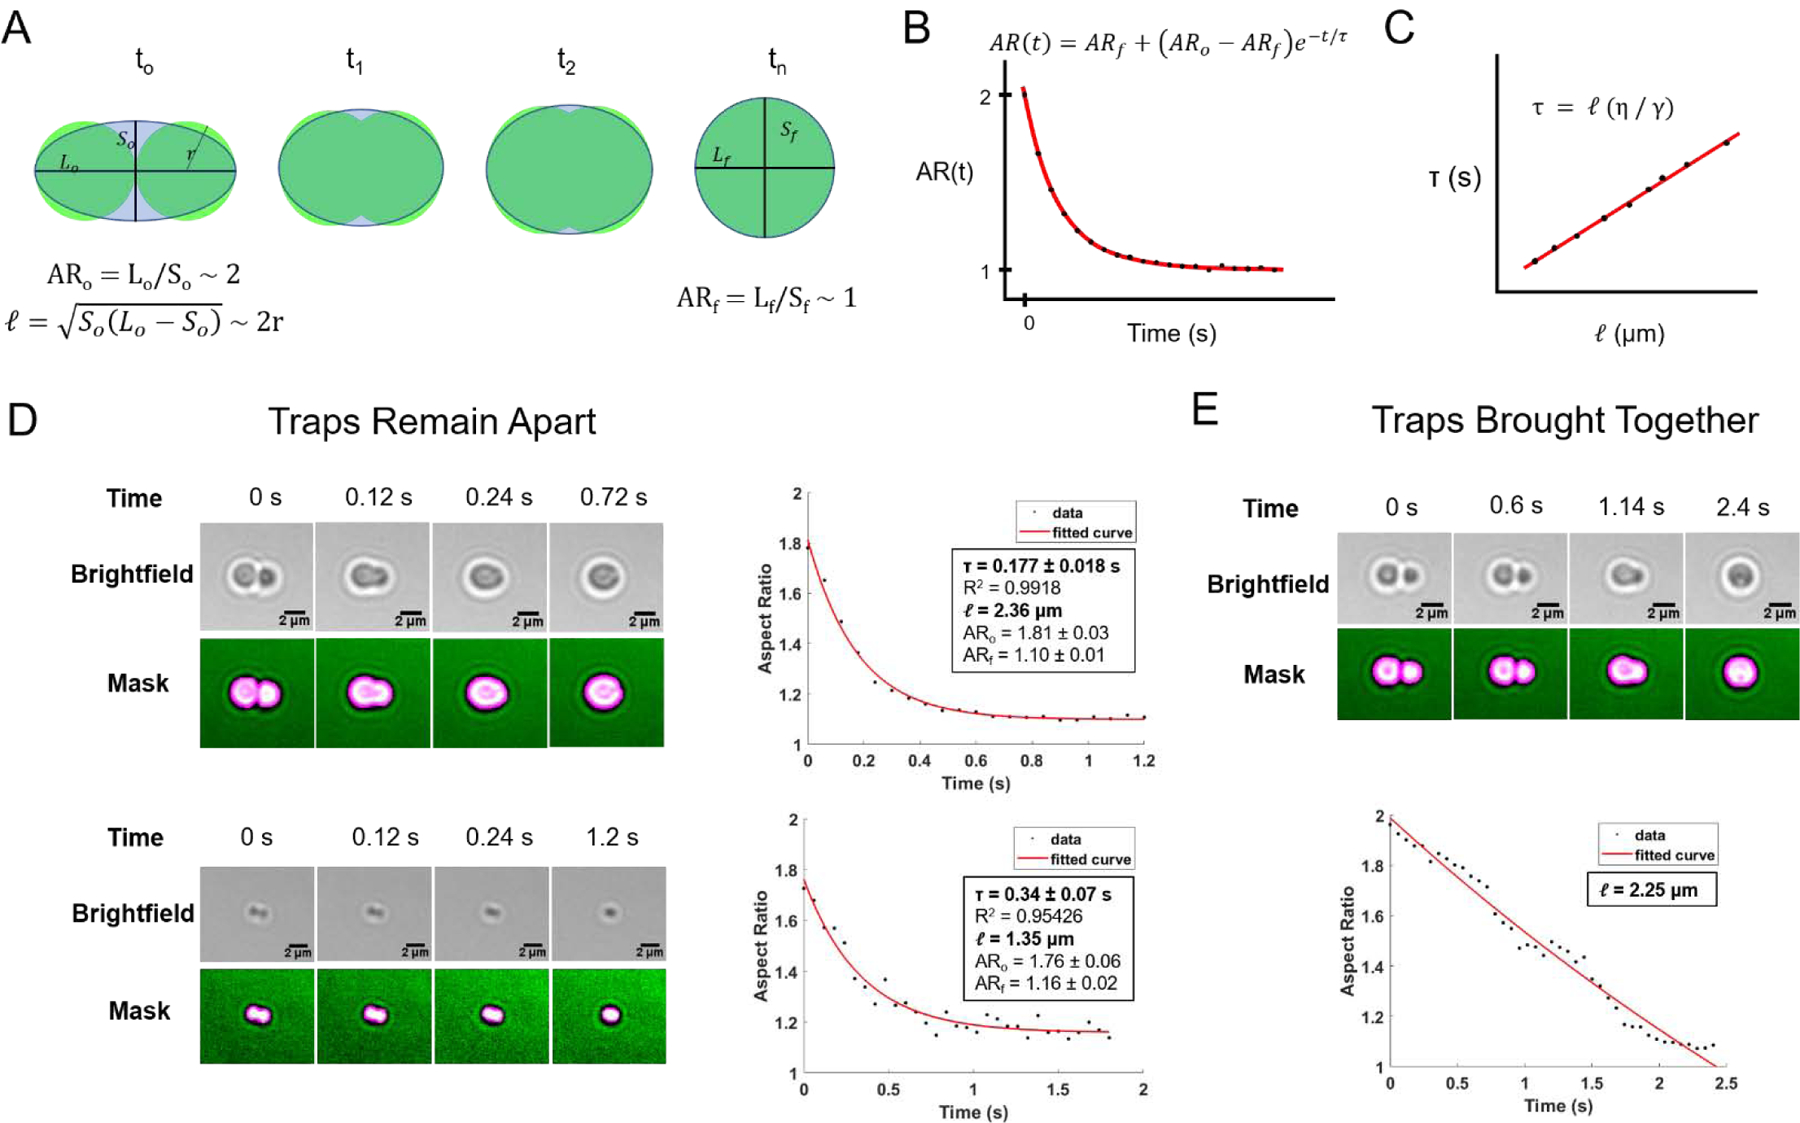
(A) Schematic of a droplet fusion event, with droplets represented in green and an ellipse modelling the fusing droplets shaded in gray. (B) Expected plot of AR over time for a single fusion event, with fitted exponential decay curve in red. (C) Expected plot of fusion time constant τ as function of length scale, with fitted linear curve in red. (D) Example fusion events between FUS-PAR condensates (top) and FUS-RNA condensates (bottom) where traps were kept apart, with fitted plots of AR over time. Binary masks of droplets shown in magenta. (E) Example fusion event between FUS-PAR condensates where traps were brought together, with plot of AR over time which fit poorly to exponential decay.
AR is plotted over time, and the initial and final frames for analysis are manually selected. The initial frame, defined as t = 0, is the frame just before AR begins to decrease exponentially. The AR in this frame, ARo should be approximately 2. The final frame is selected to be a fixed number of frames after the initial frame. Generally, the number of frames included should be at least 20, but may vary based on the time resolution of the video and the number of frames required for the fusing droplets to reach their fully relaxed state. The AR of the fully fused, relaxed droplet, ARf, should be approximately 1.
For each fusion event, the plot of AR over time can be fitted to the exponential decay function
where τ is the relaxation time constant, ARo is the initial aspect ratio, and ARf is the aspect ratio the fusing droplets approach as they relax(Figure 4B).
The length scale of the fusion event, ℓ, is given by
where Lo is the length of the major axis in the initial frame, and So is the length of the minor axis in the initial frame. This is the geometric mean diameter of each droplet just before they begin to fuse [29]. For example, two tangent, spherical droplets with equal radii, r, would have a length scale approximately equal to 2r (Figure 4A).
Once several fusion events have been analyzed in a particular condition, the plot of relaxation time constants as a function of length scale can be fitted with the linear function
where η is viscosity and γ is surface tension of the droplets (Figure 4C). The slope of this fit gives η/γ, the inverse capillary velocity of the droplets [9]. Together, these constants describe the liquid-like behavior of the RNP condensates, and these parameters can be compared with disease-linked mutations of the RBP or different structures and sequences of RNA molecules.
We have tested two approaches for fusing droplets: (1) bringing two droplets into contact and waiting for fusion to occur with the traps kept slightly apart (Figure 4D), and (2) slowly pushing the droplets together by moving one trap onto the other (Figure 4E). The second method yielded plots of AR over time which often contained a linear region as the droplets were pushed together by the traps at a constant rate. This resulted in poor fits to exponential decay. Thus, the first method, which better represents naturally occurring fusion, is preferred.
5. Diffusion of RNA molecules in condensates
Slower diffusion within condensates has been linked with the neurodegeneration phenotype for the protein Huntingtin [30]. RNA molecules can diffuse within condensates and readily exchange into and out of condensates. One advantage of forming RNP condensates in vitro is that the RNA can be easily labeled and combined with unlabeled protein. The observed RNA diffusion can be extrapolated from fluorescence recovery after photobleaching (FRAP) experiments that only bleach a portion of the droplet. We note that the RNA diffusion may be related to, but not perfectly correlate with, protein diffusion.
5.1. Acquisition of partial FRAP videos
As mentioned above, RNA can promote LLPS at low protein concentrations. Once an LLPS-forming condition is determined, variations in salt, RNA, and protein concentration – and the ratios thereof – can be tested to identify differences in droplet properties. Although optical trap fusions can be observed with smaller condensates, partial FRAP experiments require large (>5 um2) droplets to effectively bleach only a portion of the droplet. Smaller droplets will be entirely bleached if they are too small, and such complete bleaching events measure exchange of RNA into and out of the droplet, not diffusion within the droplet. Ideally, circular droplets should be selected and partially bleached in the center, with a bleach radius no greater than half that of the droplet’s radius. In general, higher concentrations of protein produce larger droplets, so protein concentration can be increased to generate sufficiently large droplets for partial FRAP. A low concentration of fluorescent RNA (~10 nM) is sufficient for imaging and performing FRAP on condensates of 1–5 μm diameter.
Photobleaching lasers used for FRAP measurements can be included as attachments on confocal or wide-field microscopes. These lasers produce a high-energy beam at a user-designated region-of-interest (in this case, a droplet) for a brief period to photobleach the fluorescent signal. The recovery of the fluorescent signal is measured over time following the bleaching event. Maintaining the z-plane focus is imperative for acquiring long FRAP videos as the complete recovery of the fluorescence signal can occur on the scale of seconds to tens of minutes. Photobleaching from image recording, and the RNA exchange rate need to be corrected for long FRAP videos. For the latter correction, a complete bleach should be recorded for each condition of interest. In addition, a few frames should be recorded just before photobleaching to serve as a reference point.
5.2. Analysis of partial FRAP videos
FRAP videos can be analyzed using a custom MATLAB script. After performing a correction for xy-plane drift, ROIs for the bleached region, bleached droplet, background, and a reference unbleached droplet are manually selected (Figure 5A–C). Based on the selected ROI, the radius of the bleached region is calculated. The intensity of the bleached region is averaged across the ROI for each frame. The background region and unbleached reference droplet are used to correct for background noise and photobleaching over time as follows:
where I(t) is the average raw intensity of the bleached ROI at time t, BG is the average intensity of the background ROI across all frames, and R(t) is the average intensity of the unbleached reference droplet ROI at time t.
Figure 5: Analysis of partial condensate FRAP to obtain apparent diffusion coefficient.
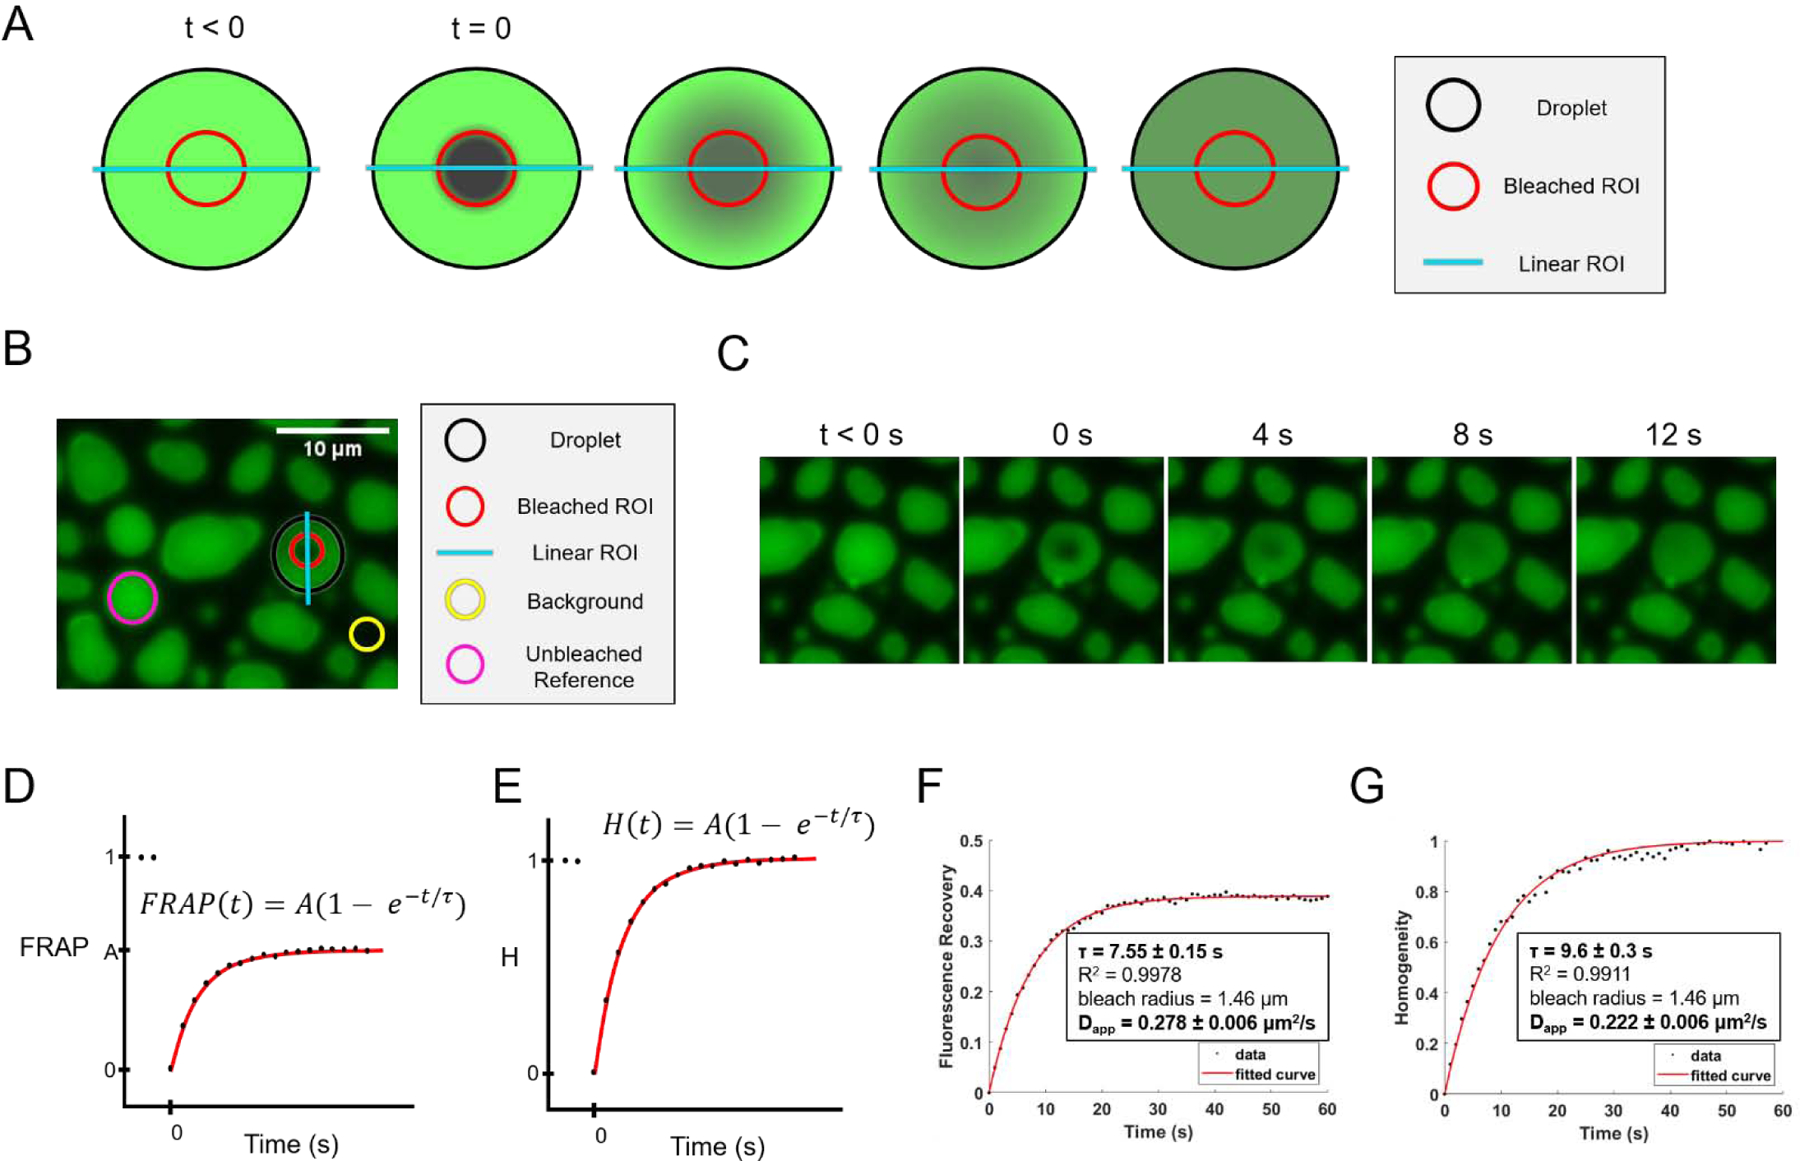
(A) Schematic of a partial FRAP event, with droplets represented in green, the droplet outlined with a dashed black border, the bleached ROI indicated with a dashed red border, and the linear ROI indicated with a dashed cyan line. (B) Example of the first post-bleach frame (t=0) for a partially bleached FUS-RNA condensate, with droplet, bleached, linear, background, and unbleached reference ROIs indicated with dashed black, red, cyan, yellow, and magenta borders, respectively. (C) Frames from a partial FRAP video. (D) Expected plot of normalized percent recovery over time, with fitted curve in red. The first two points, representing pre-bleach frames (t < 0) are not included in the fit. (E) Expected plot of normalized homogeneity over time, with fitted curve in red. The first two points, representing pre-bleach frames (t < 0) are not included in the fit. (F) Fitted plot of fluorescence recovery over time for video in 5C. (G) Fitted plot of normalized homogeneity over time for video in 5C.
Then, this corrected intensity is used to calculate the normalized percent recovery, given by
where t = 0 is defined as the first frame recorded after photobleaching and Icorr(t < 0) is the average corrected intensity in the bleached region across all pre-bleach frames [5].
Recovery due to external RNA exchange (as opposed to internal diffusion) is corrected for using the complete bleach video. Normalized percent recovery of the fully bleached droplet is calculated using the same formulas as above, with the only difference being that the bleached region encompasses the entire droplet. The corrected percent recovery of the partially bleached droplet is obtained by subtracting the normalized percent recovery of the fully bleached droplet from that of the partially bleached droplet. Without this correction, the plot of percent recovery over time may have a slanted asymptote, which reduces the quality of the fit.
The corrected percent recovery can be fitted to the exponential function
where τ is recovery time constant and A is the percent recovery reached once diffusion has completely equilibrated the intensity of the bleached region with the rest of the droplet (Figure 5D,F) [9].
The apparent diffusion coefficient, which provides an approximate measure of the diffusion of RNA in the droplet, is given by
where r is the radius of the bleached region and τ is the recovery time constant [9]. The diffusion of RNA scales with the area of the bleached region because it takes longer for labeled molecules with a fixed diffusion coefficient to diffuse through a larger bleached area, resulting in slower fluorescence recovery.
Alternatively, internal diffusion can be quantified by measuring the “homogeneity” of the droplet [31]. The main advantage of this analysis approach is that it accounts for external exchange of RNA without the need for a fully bleached reference droplet. However, fits obtained with this method were less reliable as, for some bleach events, homogeneity would gradually increase over time even after the intensity in the droplet appeared to equilibrate, resulting in a slanted asymptote and a lower quality fit.
This approach makes use of an additional, manually-selected linear ROI which spans the droplet along the axis of the bleached region’s diameter. For each pixel in each frame, intensity is corrected for background noise and photobleaching using the background (averaged across the ROI and across all frames) and unbleached reference (averaged across the ROI) intensities. The linear ROI is divided into two sections, bleached and unbleached, based on the selected bleach ROI and droplet ROI. The unbleached section includes all pixels in the droplet but not in the bleached region. The average intensity in each section is calculated for each frame, and the homogeneity is given by
where Iin(t) and Iout(t) are the average intensities in the bleached and unbleached sections, respectively, at time t [24]. The homogeneity is then normalized as follows:
where H(t < 0) is the average homogeneity across all pre-bleach frames.
Normalized homogeneity can be fitted to the exponential function
where τ is recovery time constant and A is the homogeneity reached once diffusion has equilibrated the intensity of the bleached region with the rest of the droplet, expected to be approximately 1 (Figure 5E,G). The recovery time constant can then be used to calculate Dapp using the equation given above.
This approach does not include a correction for external RNA exchange since it is assumed that exchange occurs throughout the droplet, and thus affects intensity both inside and outside of the bleached region.
6. Conclusions
Together, these methods enable one to investigate RNP complexes with single-molecule resolution. The biophysical characteristics of these RNP granules can be further tested with the ensemble methods described above. Altering the salt, RNA, or protein concentration will allow further interrogation of RNP dynamics. Studying LLPS with single-molecule tools is necessary for a deeper understanding of the nucleation, condensation, and maturation of condensates.
Highlights:
Single-molecule nucleation assays track protein oligomerization kinetics with single molecule resolution
Optical tweezers enables measurement of controlled fusion events for analysis of liquid-like properties
Diffusion of RNA molecules within condensates can be extrapolated from FRAP
Acknowledgements
We are grateful to the Ha and Myong labs for helpful discussions while designing these experiments. We acknowledge funding support from 1-F31-NS113439 (to K.R.), 1-T32-GM007231-45 (to K.R.), 1-RF1-NS113636-01 (to S.M.), 1-RF1-AG071326-01 (to S.M.), and the National Science Foundation PHY-1430124 via the Center for Physics of Living Cells (to S.M.).
Abbreviations:
- ALEX
alternating excitation
- FRAP
fluorescence recovery after photobleaching
- FRET
fluorescence resonance energy transfer
- LLPS
liquid-liquid phase separation
- RBP
RNA binding protein
- RNP
ribonucleoprotein
- TIRF
total internal reflection fluorescence
Footnotes
Publisher's Disclaimer: This is a PDF file of an unedited manuscript that has been accepted for publication. As a service to our customers we are providing this early version of the manuscript. The manuscript will undergo copyediting, typesetting, and review of the resulting proof before it is published in its final form. Please note that during the production process errors may be discovered which could affect the content, and all legal disclaimers that apply to the journal pertain.
The authors declare that they do not have any competing interests.
Data Availability
The code used to analyze data in this manuscript is available from the Myong lab Github at this web address: https://github.com/Myong-Lab. Other single-molecule codes are available from the Center for Physics of Living Cells at this web address: https://cplc.illinois.edu/software/.
References
- [1].Alberti S, Gladfelter A, Mittag T, Considerations and Challenges in Studying Liquid-Liquid Phase Separation and Biomolecular Condensates, Cell 176(3) (2019) 419–434. [DOI] [PMC free article] [PubMed] [Google Scholar]
- [2].Patel A, Lee HO, Jawerth L, Maharana S, Jahnel M, Hein MY, Stoynov S, Mahamid J, Saha S, Franzmann TM, Pozniakovski A, Poser I, Maghelli N, Royer LA, Weigert M, Myers EW, Grill S, Drechsel D, Hyman AA, Alberti S, A Liquid-to-Solid Phase Transition of the ALS Protein FUS Accelerated by Disease Mutation, Cell 162(5) (2015) 1066–77. [DOI] [PubMed] [Google Scholar]
- [3].Khong A, Matheny T, Jain S, Mitchell SF, Wheeler JR, Parker R, The Stress Granule Transcriptome Reveals Principles of mRNA Accumulation in Stress Granules, Mol Cell 68(4) (2017) 808–820 e5. [DOI] [PMC free article] [PubMed] [Google Scholar]
- [4].Maharana S, Wang J, Papadopoulos DK, Richter D, Pozniakovsky A, Poser I, Bickle M, Rizk S, Guillen-Boixet J, Franzmann TM, Jahnel M, Marrone L, Chang YT, Sterneckert J, Tomancak P, Hyman AA, Alberti S, RNA buffers the phase separation behavior of prion-like RNA binding proteins, Science 360(6391) (2018) 918–921. [DOI] [PMC free article] [PubMed] [Google Scholar]
- [5].Niaki AG, Sarkar J, Cai X, Rhine K, Vidaurre V, Guy B, Hurst M, Lee JC, Koh HR, Guo L, Fare CM, Shorter J, Myong S, Loss of Dynamic RNA Interaction and Aberrant Phase Separation Induced by Two Distinct Types of ALS/FTD-Linked FUS Mutations, Mol Cell (2020). [DOI] [PMC free article] [PubMed] [Google Scholar]
- [6].Schwartz JC, Wang X, Podell ER, Cech TR, RNA seeds higher-order assembly of FUS protein, Cell Rep 5(4) (2013) 918–25. [DOI] [PMC free article] [PubMed] [Google Scholar]
- [7].Elbaum-Garfinkle S, Matter over mind: Liquid phase separation and neurodegeneration, J Biol Chem 294(18) (2019) 7160–7168. [DOI] [PMC free article] [PubMed] [Google Scholar]
- [8].Bouchard JJ, Otero JH, Scott DC, Szulc E, Martin EW, Sabri N, Granata D, Marzahn MR, Lindorff-Larsen K, Salvatella X, Schulman BA, Mittag T, Cancer Mutations of the Tumor Suppressor SPOP Disrupt the Formation of Active, Phase-Separated Compartments, Molecular Cell 72(1) (2018) 19–36.e8. [DOI] [PMC free article] [PubMed] [Google Scholar]
- [9].Elbaum-Garfinkle S, Kim Y, Szczepaniak K, Chen CC, Eckmann CR, Myong S, Brangwynne CP, The disordered P granule protein LAF-1 drives phase separation into droplets with tunable viscosity and dynamics, Proc Natl Acad Sci U S A 112(23) (2015) 7189–94. [DOI] [PMC free article] [PubMed] [Google Scholar]
- [10].Alexander EJ, Ghanbari Niaki A, Zhang T, Sarkar J, Liu Y, Nirujogi RS, Pandey A, Myong S, Wang J, Ubiquilin 2 modulates ALS/FTD-linked FUS-RNA complex dynamics and stress granule formation, Proc Natl Acad Sci U S A 115(49) (2018) E11485–E11494. [DOI] [PMC free article] [PubMed] [Google Scholar]
- [11].Langdon EM, Qiu Y, Ghanbari Niaki A, McLaughlin GA, Weidmann CA, Gerbich TM, Smith JA, Crutchley JM, Termini CM, Weeks KM, Myong S, Gladfelter AS, mRNA structure determines specificity of a polyQ-driven phase separation, Science 360(6391) (2018) 922–927. [DOI] [PMC free article] [PubMed] [Google Scholar]
- [12].Rhine K, Makurath MA, Liu J, Skanchy S, Lopez C, Catalan KF, Ma Y, Fare CM, Shorter J, Ha T, Chemla YR, Myong S, ALS/FTLD-Linked Mutations in FUS Glycine Residues Cause Accelerated Gelation and Reduced Interactions with Wild-Type FUS, Mol Cell 80(4) (2020) 666–681 e8. [DOI] [PMC free article] [PubMed] [Google Scholar]
- [13].Hofweber M, Hutten S, Bourgeois B, Spreitzer E, Niedner-Boblenz A, Schifferer M, Ruepp MD, Simons M, Niessing D, Madl T, Dormann D, Phase Separation of FUS Is Suppressed by Its Nuclear Import Receptor and Arginine Methylation, Cell 173(3) (2018) 706–719 e13. [DOI] [PubMed] [Google Scholar]
- [14].Burke KA, Janke AM, Rhine CL, Fawzi NL, Residue-by-Residue View of In Vitro FUS Granules that Bind the C-Terminal Domain of RNA Polymerase II, Mol Cell 60(2) (2015) 231–41. [DOI] [PMC free article] [PubMed] [Google Scholar]
- [15].Alberti S, Saha S, Woodruff JB, Franzmann TM, Wang J, Hyman AA, A User’s Guide for Phase Separation Assays with Purified Proteins, J Mol Biol 430(23) (2018) 4806–4820. [DOI] [PMC free article] [PubMed] [Google Scholar]
- [16].Mann JR, Gleixner AM, Mauna JC, Gomes E, DeChellis-Marks MR, Needham PG, Copley KE, Hurtle B, Portz B, Pyles NJ, Guo L, Calder CB, Wills ZP, Pandey UB, Kofler JK, Brodsky JL, Thathiah A, Shorter J, Donnelly CJ, RNA Binding Antagonizes Neurotoxic Phase Transitions of TDP-43, Neuron 102(2) (2019) 321–338 e8. [DOI] [PMC free article] [PubMed] [Google Scholar]
- [17].Roden C, Gladfelter AS, RNA contributions to the form and function of biomolecular condensates, Nat Rev Mol Cell Biol (2020). [DOI] [PMC free article] [PubMed] [Google Scholar]
- [18].Boeynaems S, Holehouse AS, Weinhardt V, Kovacs D, Van Lindt J, Larabell C, Van Den Bosch L, Das R, Tompa PS, Pappu RV, Gitler AD, Spontaneous driving forces give rise to protein-RNA condensates with coexisting phases and complex material properties, Proc Natl Acad Sci U S A 116(16) (2019) 7889–7898. [DOI] [PMC free article] [PubMed] [Google Scholar]
- [19].Sarkar J, Myong S, Single-Molecule and Ensemble Methods to Probe Initial Stages of RNP Granule Assembly, Methods Mol Biol 1814 (2018) 325–338. [DOI] [PubMed] [Google Scholar]
- [20].Ha T, Rasnik I, Cheng W, Babcock HP, Gauss GH, Lohman TM, Chu S, Initiation and re-initiation of DNA unwinding by the Escherichia coli Rep helicase, Nature 419(6907) (2002) 638–41. [DOI] [PubMed] [Google Scholar]
- [21].Roy R, Hohng S, Ha T, A practical guide to single-molecule FRET, Nat Methods 5(6) (2008) 507–16. [DOI] [PMC free article] [PubMed] [Google Scholar]
- [22].Joo C, Ha T, Prism-type total internal reflection microscopy for single-molecule FRET, Cold Spring Harb Protoc 2012(12) (2012). [DOI] [PubMed] [Google Scholar]
- [23].Joo C, Ha T, Preparing sample chambers for single-molecule FRET, Cold Spring Harb Protoc 2012(10) (2012) 1104–8. [DOI] [PubMed] [Google Scholar]
- [24].Riback JA, Bowman MA, Zmyslowski AM, Plaxco KW, Clark PL, Sosnick TR, Commonly used FRET fluorophores promote collapse of an otherwise disordered protein, Proc Natl Acad Sci U S A 116(18) (2019) 8889–8894. [DOI] [PMC free article] [PubMed] [Google Scholar]
- [25].Kapanidis A, Majumdar D, Heilemann M, Nir E, Weiss S, Sample Preparation and Data Acquisition for mus-ALEX, Cold Spring Harb Protoc 2015(11) (2015) 1029–31. [DOI] [PubMed] [Google Scholar]
- [26].Moon SL, Morisaki T, Khong A, Lyon K, Parker R, Stasevich TJ, Multicolour single-molecule tracking of mRNA interactions with RNP granules, Nat Cell Biol 21(2) (2019) 162–168. [DOI] [PMC free article] [PubMed] [Google Scholar]
- [27].Kaur T, Alshareedah I, Wang W, Ngo J, Moosa MM, Banerjee PR, Molecular Crowding Tunes Material States of Ribonucleoprotein Condensates, Biomolecules 9(2) (2019). [DOI] [PMC free article] [PubMed] [Google Scholar]
- [28].Lee WM, Reece PJ, Marchington RF, Metzger NK, Dholakia K, Construction and calibration of an optical trap on a fluorescence optical microscope, Nat Protoc 2(12) (2007) 3226–38. [DOI] [PubMed] [Google Scholar]
- [29].Brangwynne CP, Mitchison TJ, Hyman AA, Active liquid-like behavior of nucleoli determines their size and shape in Xenopus laevis oocytes, Proc Natl Acad Sci U S A 108(11) (2011) 4334–9. [DOI] [PMC free article] [PubMed] [Google Scholar]
- [30].Li L, Liu H, Dong P, Li D, Legant WR, Grimm JB, Lavis LD, Betzig E, Tjian R, Liu Z, Real-time imaging of Huntingtin aggregates diverting target search and gene transcription, Elife 5 (2016). [DOI] [PMC free article] [PubMed] [Google Scholar]
- [31].Freeman Rosenzweig ES, Xu B, Kuhn Cuellar L, Martinez-Sanchez A, Schaffer M, Strauss M, Cartwright HN, Ronceray P, Plitzko JM, Forster F, Wingreen NS, Engel BD, Mackinder LCM, Jonikas MC, The Eukaryotic CO2-Concentrating Organelle Is Liquid-like and Exhibits Dynamic Reorganization, Cell 171(1) (2017) 148–162 e19. [DOI] [PMC free article] [PubMed] [Google Scholar]