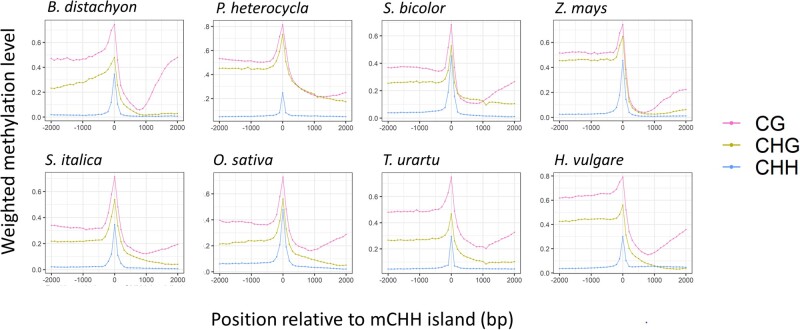
Fig. 2.
Profiles of methylation across mCHH islands in each sequence context. The x axis provides the distance in base pairs (bp) from a detected island, which is centered at zero. The points on the graph represent weighted methylation levels in 100 bp windows. The islands were not at a fixed distance from genes, because they were determined by significance tests, but they were within the 2 kb 5′ flanking region of genes.

