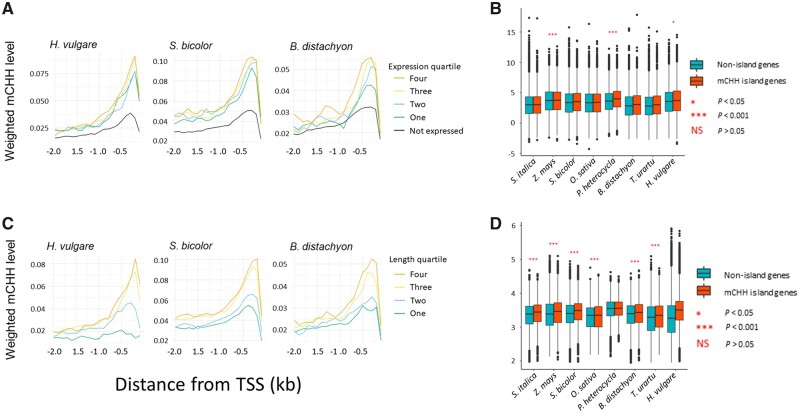
Fig. 3.
mCHH island relative to gene expression and length. (A) Profiles of near-gene methylation in genes separated into four quartiles of expression and into nonexpressed genes. The graphs illustrate for some species that genes in the higher quartiles tend to have higher 5′ flanking CHH methylation. (B) Expression levels between mCHH island genes and nonisland genes. Significance levels between the two categories are shown for each species, with NS = not significant. (C) Profiles of near-gene methylation in genes separated into four quartiles for gene length. (D) The length of island and nonisland genes. Significance levels between the two categories are shown for each species, with NS = not significant. These length measures were based on distances from the TSS to the TTS, but the results hold using the length of exons in the longest transcript (supplementary fig. S6, Supplementary Material online). For panels (A) and (C), the species were chosen because they represent a range of genome size, as in figure 1. The remaining species are shown in supplementary figures S4 and S5, Supplementary Material online. For (B) and (D), the box plots present the median, with the edges representing the upper and lower quartiles.

