
FIGURE 2.
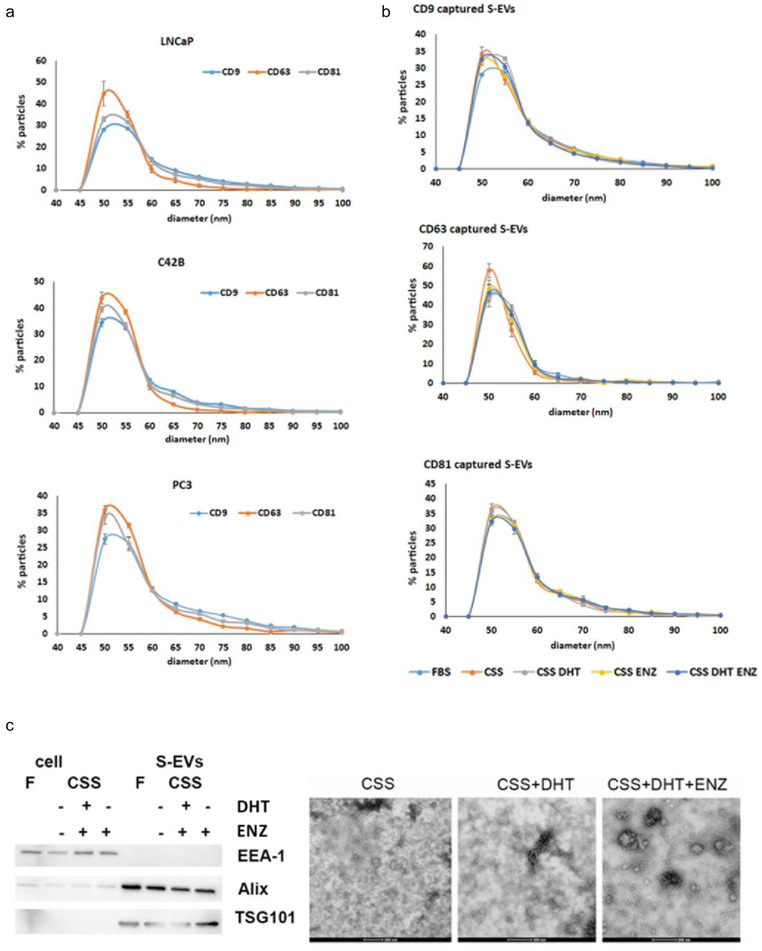
S‐EV characterisation from prostate cancer cells. (a) Frequency distribution of the size of S‐EVs from AR positive LNCaP and C42B cells, and AR negative PC3 cells; (b) Treatment with androgens alters the diameter of S‐EVs secreted by LNCaP cells; (c) A representative western blot of cells and S‐EVs probed with positive markers TSG101 and Alix, or a negative marker EEA‐1. TEM images of S‐EVs isolated from LNCaP cells, treated with androgen DHT, or in the presence of androgen antagonist ENZ. Scale bar: 200 nm. Data of frequency distribution are mean ± SEM (n = 3 independent experiments). F: FBS, CSS: charcoal‐stripped serum, DHT: dihydrotestosterone, ENZ: enzalutamide.