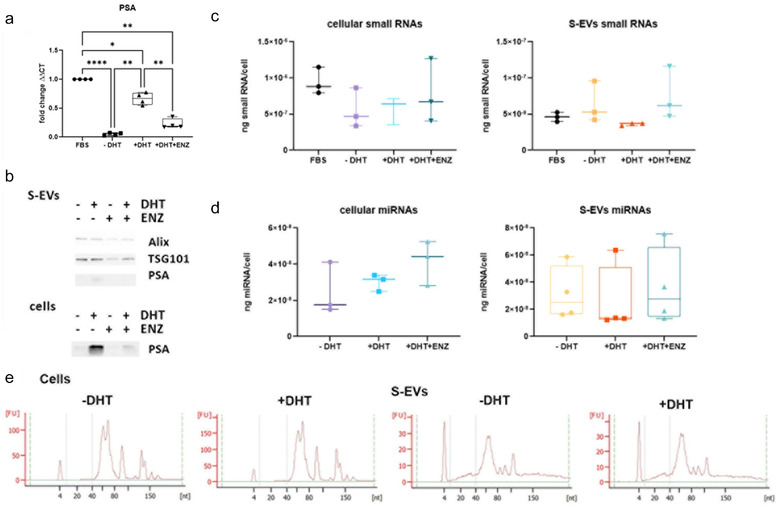
FIGURE 5.

The overall profile of small RNA derived from S‐EVs or parental LNCaP cells. (a) Quantitative RT PCR analysis of cellular mRNA transcript of PSA to indicate activation of AR signalling axis (RM‐one way ANOVA, n = 4 independent experiments, *P < 0.05, **P < 0.01,****P < 0.0001); (b) A representative western blot of S‐EVs; (c) and (d) Yield of overall small RNAs (c) and miRs (d) from parental cells and isolated S‐EVs (n = 3–4 independent experiments). (e) Representative small RNA profile from parental cells and isolated S‐EVs with and without DHT treatment, analysed using Agilent Bioanalyzer.
