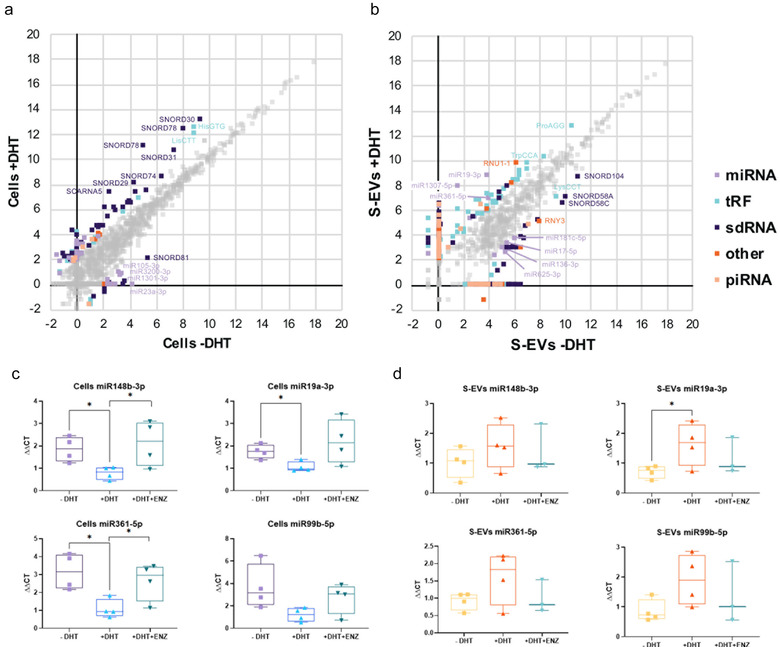
FIGURE 7.

Differential expression of small RNA upon androgen stimulation. (a) and (b) Graph of LNCaP cells (a) and S‐EVs isolated from conditioned medium (b). Axes are in log2 scale. Differentially expressed small RNAs (expression fold change > 4), are coloured according to the legend. Small RNAs with a change in expression level less than 4‐fold are in grey; c) and d) Validation of cellular (c) and S‐EVs (d) miRNAs under androgen manipulation. QRT PCR analysis on paired parental and isolated S‐EVs from LNCaP cells treated with DHT +/‐ androgen antagonist ENZ. P‐values are indicated by asterisk (unpaired t‐test, n = 3–4 independent experiments; *P < 0.05).
