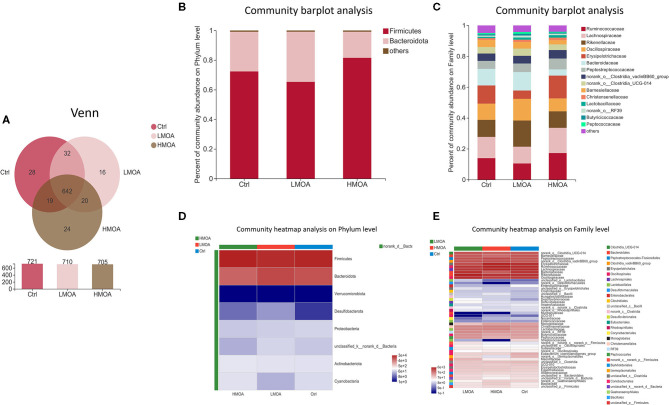
Figure 6.
The microbial community composition of cecal in 42-d broilers as affected by dietary MOA supplementation. (A) Venn diagrams of dietary treatments at the OTUs level. (B,C) Distribution of community barplot in cecum microorganism at the phylum and family level. (D,E) Heatmap of the cecum microorganism relative richness at the phylum and family level among dietary treatments. Ctrl: a basal diet of corn-soybean meal with 0 mg/kg of mixed organic acid; LMOA: a basal diet with 3,000 mg/kg of mixed organic acids; HMOA: a basal diet with 6,000 mg/kg of mixed organic acids. n = 6.

