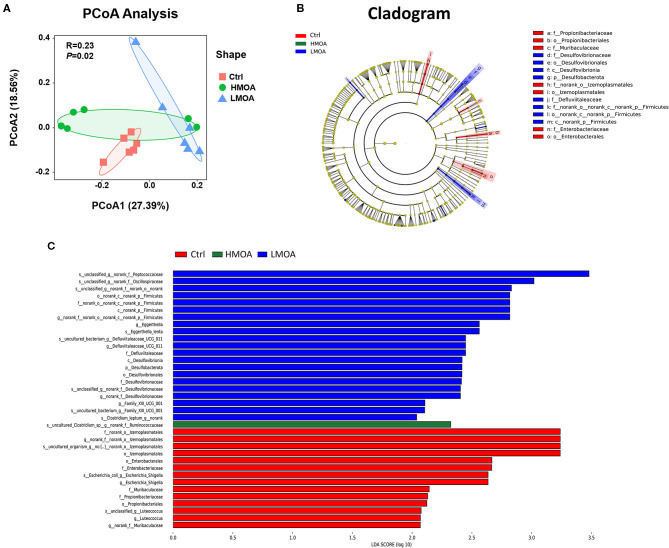
Figure 7.
The analysis of bacterial β-diversity and microbial structures in 42 d-broilers cecum as affected by dietary MOA supplementation. (A) Principal co-ordinates analysis (PCoA) diagram of the cecum bacterial communities based on bray-Curtis distance calculated from OTUs abundance matrix. The significant difference test between groups using Analysis of similarities (ANOSIM). (B) Discriminant analysis of LEfSe multi-level species difference from phylum to genus level. (C) Histogram of linear discriminant analysis (LDA) from phylum to genus level. The values were examined by the non-parametric factorial Kruskal-Wallis sum-rank test to identify the microorganisms with significant difference characteristics and using linear discriminant analysis to estimate the magnitude of the effect of abundance on the difference effect for each species. Ctrl: a basal diet of corn-soybean meal with 0 mg/kg of mixed organic acid; LMOA: a basal diet with 3,000 mg/kg of mixed organic acids; HMOA: a basal diet with 6,000 mg/kg of mixed organic acids. n = 6.

