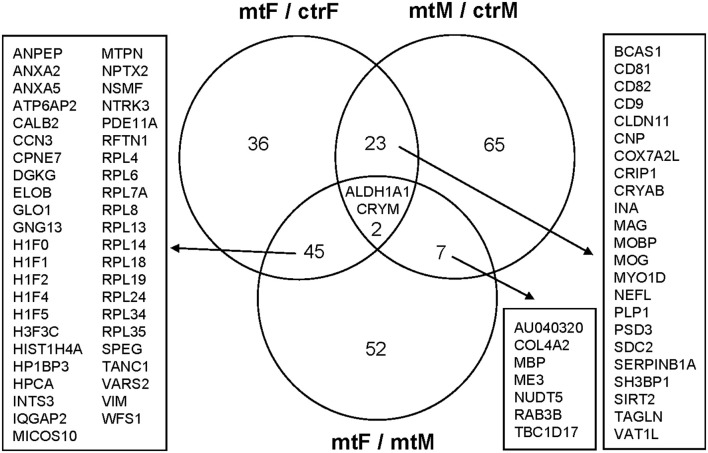
Figure 8.
Overlapping and non-overlapping changes in protein expression in the MeA of female and male Foxp2+/– mice. Venn Diagram of the differentially expressed proteins in the three comparisons from Figure 8: Foxp2+/– female vs. ctr female (mtF/ctrF), Foxp2+/– male vs. ctr male (mtM/ctrM), and Foxp2+/– female vs. Foxp2+/– male (mtF/mtM; Log2F C≥ |1.11|). The signature of proteins and neuromodulators in the amygdala of Foxp2+/– mice was sex-specific.

