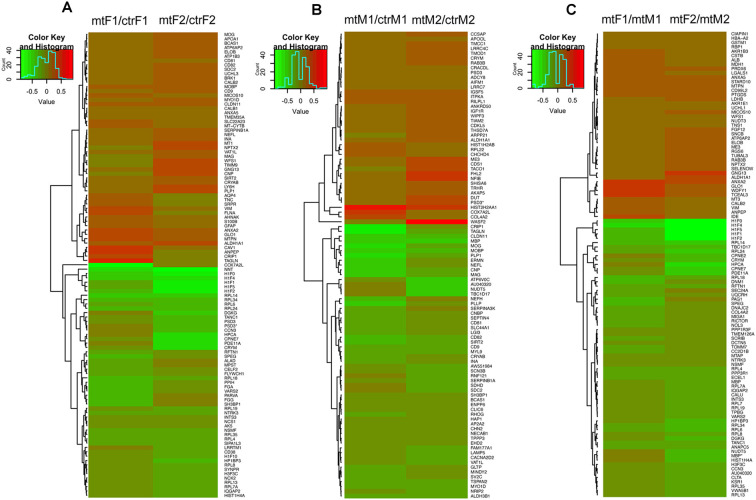
Figure 9.
Heatmaps of differentially expressed proteins in the MeA of female and male Foxp2+/– mice. Pooled microdissected MeA tissue from thee brains was run in duplicate. Ratios for each duplicate are shown in the x-axis and protein names (symbols) of differentially expressed proteins are displayed on the y-axis on the right. Panels (A–C) show proteins significantly upregulated (red) or downregulated (green) in three comparisons: Foxp2+/– female vs. ctr female (mtF/ctrF) (A), Foxp2+/– male vs. ctr male (mtM/ctrM) (B), Foxp2+/– female vs. Foxp2+/– male (mtF/mtM) (C) (Log2 fold change ≥ |1.11|). Proteins were clustered based on similarity of expression between the experimental and control groups, which is indicated by the dendrogram. The color key and histogram panel indicates the Z-scores of expression and the expression counts. See Supplementary Table 1 for a full list of altered proteins in each comparison.

