Fig. 2.

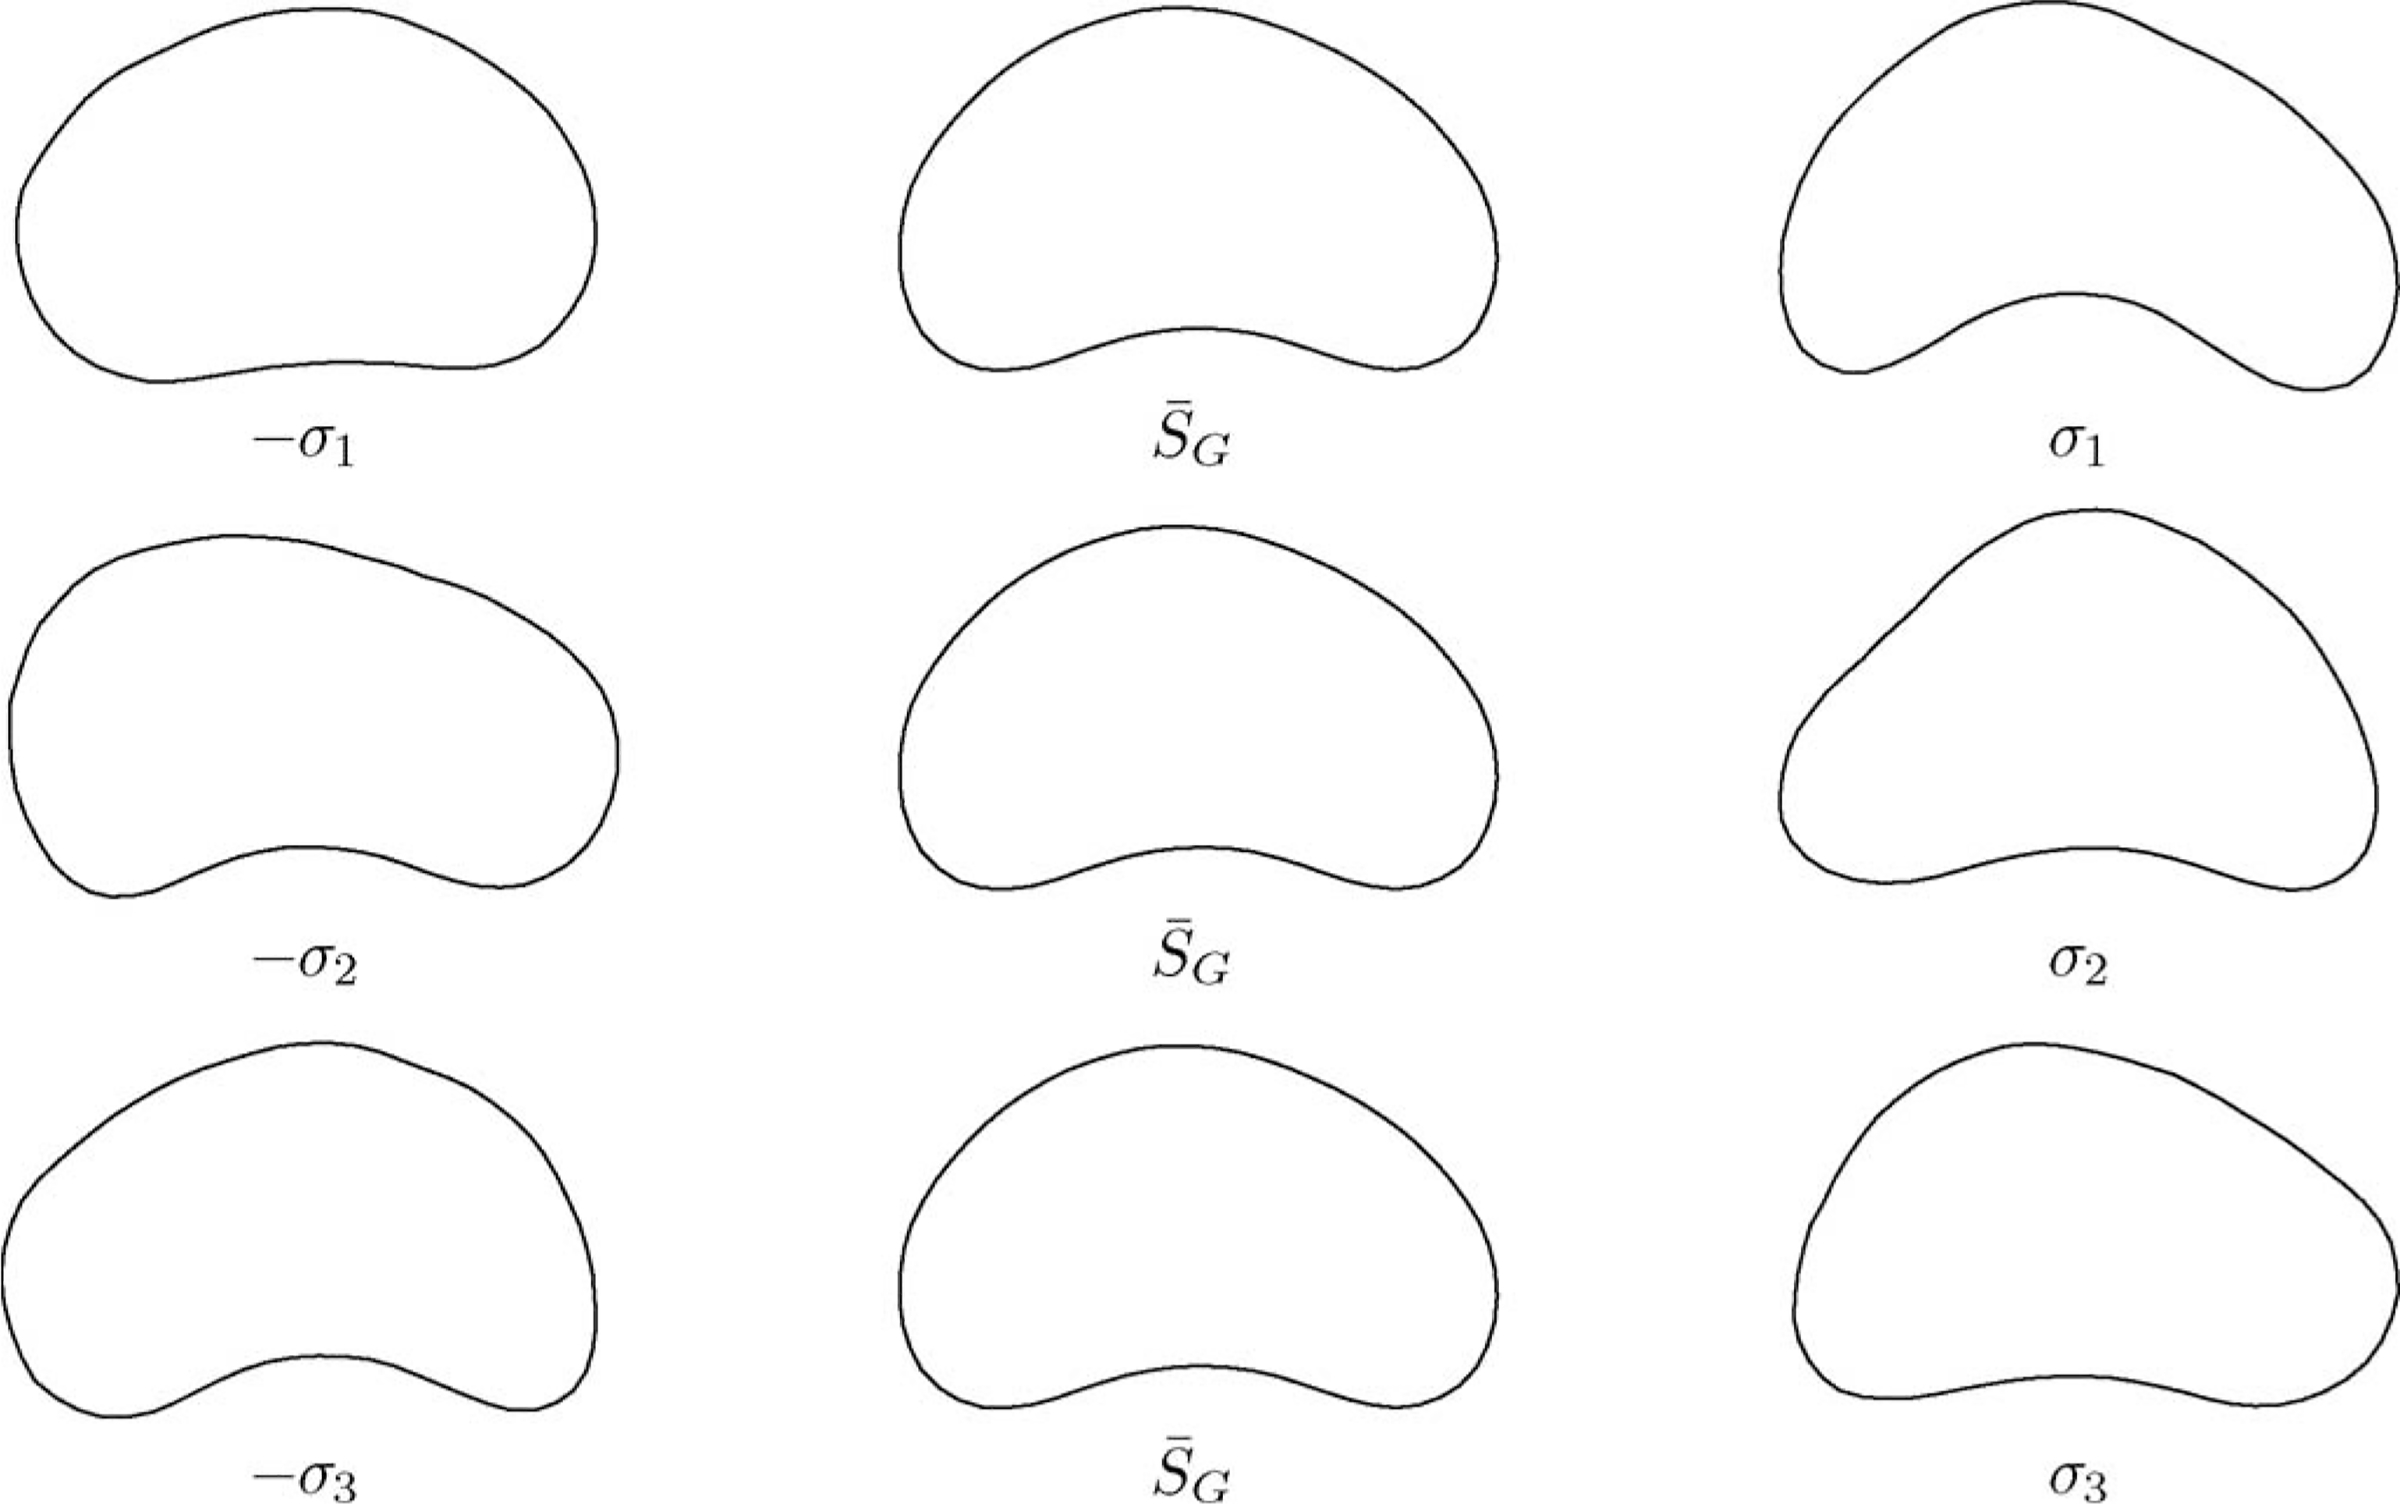
Example shapes generated by the GPSS. The mean shape is drawn in the second column. Shapes generated by varying the mean shape with the largest three modes of variation (σ1, σ2, σ3) are drawn in the first and third rows, respectively.

Example shapes generated by the GPSS. The mean shape is drawn in the second column. Shapes generated by varying the mean shape with the largest three modes of variation (σ1, σ2, σ3) are drawn in the first and third rows, respectively.