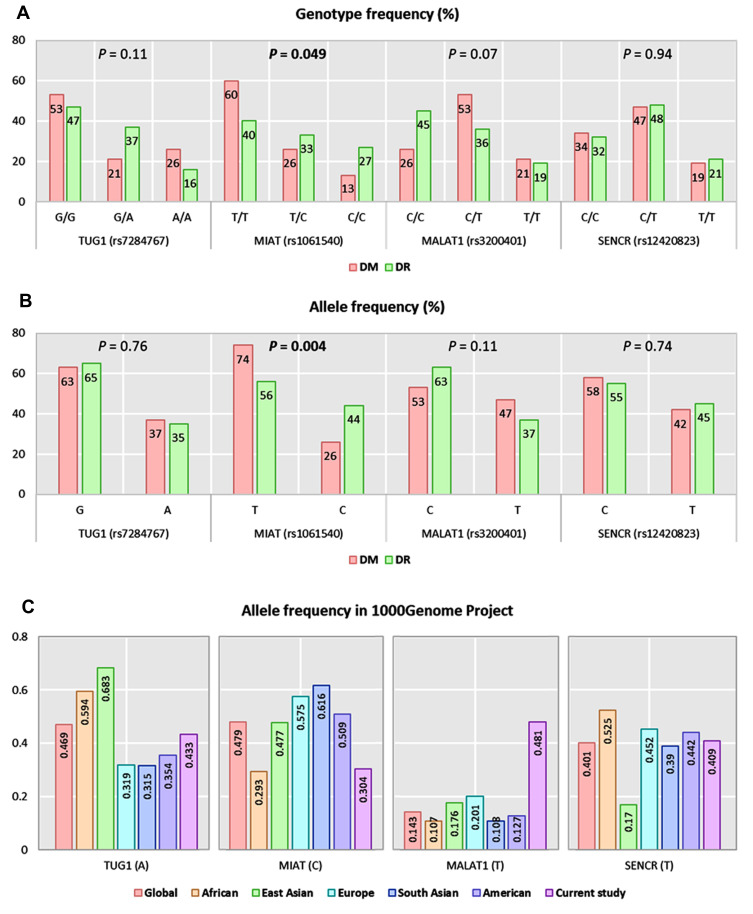
Figure 1.
Genotype and allele frequencies of the studied genetic variants. (A) Genotype frequencies of polymorphisms. (B) Allele frequencies of polymorphisms. A Chi-square test was applied. Statistical significance was set at P < 0.05. (C) Allele frequencies of TUG1 (rs7284767), MIAT (rs1061540), MALAT1 (rs3200401), and SENCR (rs12420823) in 1000Genome Project. Bold values indicate significance at P-value < 0.05.

